
AETHON Expert Advisor · XAUUSD · MT5
Aethon Crest
A systematic approach to gold trends
Aethon Crest gives gold traders a detailed, automated way to evaluate direction and manage exposure on MetaTrader 5. Its design combines two embedded neural-network ensembles with a defined execution and exit framework. One ensemble assesses market direction; the other decides whether that directional signal is strong enough to trade. For traders looking for a premium gold EA, Crest offers a specific technical proposition: a structured decision process, controlled additions and several ways to manage positions after entry.
The strategy works on XAUUSD and evaluates its directional model at the beginning of each new hourly bar. This gives it a different rhythm from systems that open positions on every small change in price. Between those hourly decisions, its trade-management features continue handling open exposure. That separation is useful to understand when choosing an EA: the model determines whether an opportunity qualifies, while the position-management rules determine how the resulting trade develops, takes partial profit or exits.
Two ensembles with separate responsibilities
Crest's Tide and Crest components each contain seven neural networks. Together, the two ensembles read a market state containing 1,296 values. The documented inputs include 208 descriptive values covering hourly structure, bar shape, oscillators and higher-timeframe context, together with the raw shape of the preceding 272 hourly bars. This is a substantial input framework, but its practical purpose is straightforward: give the model several ways to describe the market before it decides whether to open a trade.
Tide provides the directional assessment, while Crest acts as the qualification check. A position can open when the direction and qualifying condition agree. This two-part design lets the EA distinguish between having a directional view and having a view strong enough to act on. It does not make the model infallible. Its appeal is the defined relationship between analysis and execution, which can be examined in a test and compared with the resulting orders, exits and account-level exposure.
Waves provide a framework for additional entries
When the conditions continue to qualify, Crest can add further entries called Waves. The reviewed source permits up to three Waves per direction. A new Wave needs both a time interval and a better price than the previous entry. The settings therefore provide boundaries around when the system can extend an existing directional position. Additional entries arise from those conditions, rather than an unrestricted sequence of orders placed as soon as the previous trade moves into a loss.
The absence of grid averaging and martingale sizing is an identifiable feature of Crest's design. It should still be assessed as a strategy capable of holding several positions in the same direction. Multiple Waves can create correlated exposure, and a reversal can affect them together. For a buyer, the useful distinction is that the addition rules are explicit and can be evaluated alongside position sizing. The number of open trades is only one part of the exposure picture; their combined volume also matters.
Stops and exits built into the trade lifecycle
Every Crest trade opens with a hard stop-loss and take-profit. The reviewed configuration also supports closing positions when Tide turns against their direction. This gives the EA more than one reason to leave a trade: a price boundary can be reached, or the directional assessment can change. Those rules make its exit logic easier to explain and test. They also distinguish the strategy from a basket system that relies on an eventual return toward an averaged entry price.
Stops define the intended exit process, but actual fills remain subject to market conditions and broker execution. A chart price crossing a stop does not guarantee the precise requested fill during a gap or rapid move. Crest's product proposition is therefore a rule-based trade lifecycle, rather than a promise of perfectly bounded losses. Users should evaluate the complete relationship between entry volume, stop distance and simultaneous positions when deciding whether a particular configuration fits their account.
Bank takes partial profit; Ride manages the remainder
Crest includes two named management features. Bank can close part of a position once its configured profit threshold is reached. In the reviewed source defaults, the partial close is 50% of the position. Ride manages the remaining exposure through a trailing stop with its own activation level, distance and adjustment step. These are configurable features, so the exact behaviour depends on the settings used in the installed build and the broker's permitted volume increments.
This combination supports a familiar trading preference: realise some of a favourable move while leaving part of the position open for further movement. It also changes the meaning of simple trade statistics. Partial closes, remaining exposure and later exits all contribute to the final account result. A buyer should therefore examine the net profit and drawdown together, rather than judging Crest solely by the percentage of trades reported as profitable. Its management features are part of the strategy, not separate from its performance.
What the saved backtest shows
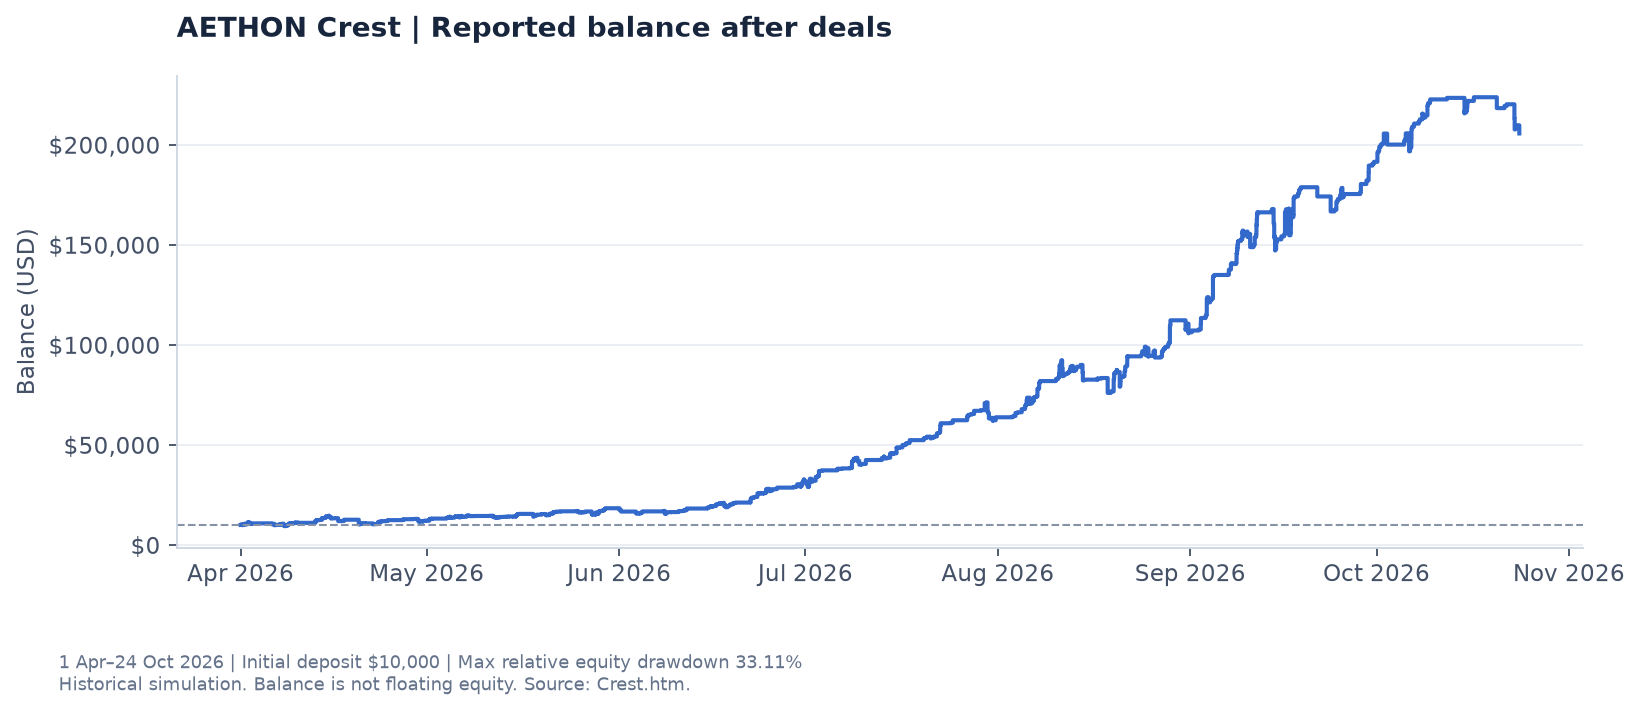
The reviewed Crest report covers 1 April to 24 October 2026 on XAUUSD, with a $10,000 starting deposit and history labelled 100% real ticks. It records $195,641.73 net profit, equivalent to a 1,956.42% arithmetic return on the initial deposit. The report lists 945 trades, an 81.27% profitable-trade rate and a profit factor of 1.82. Ending balance, calculated from the initial deposit plus reported net profit, is $205,641.73. These are historical simulated results for the saved configuration.
The scale of the profit makes the exposure measures particularly important. Maximum relative equity drawdown was 33.11%. The report separately lists a largest cash equity drawdown of $27,617.35, with 16.16% attached to that particular cash-drawdown event. Those are different measures and should not be substituted for each other. This page uses 33.11% when discussing maximum relative equity drawdown. That provides a clearer account of the deepest percentage decline recorded by the tester, including floating exposure.
Reading the chart with the statistics
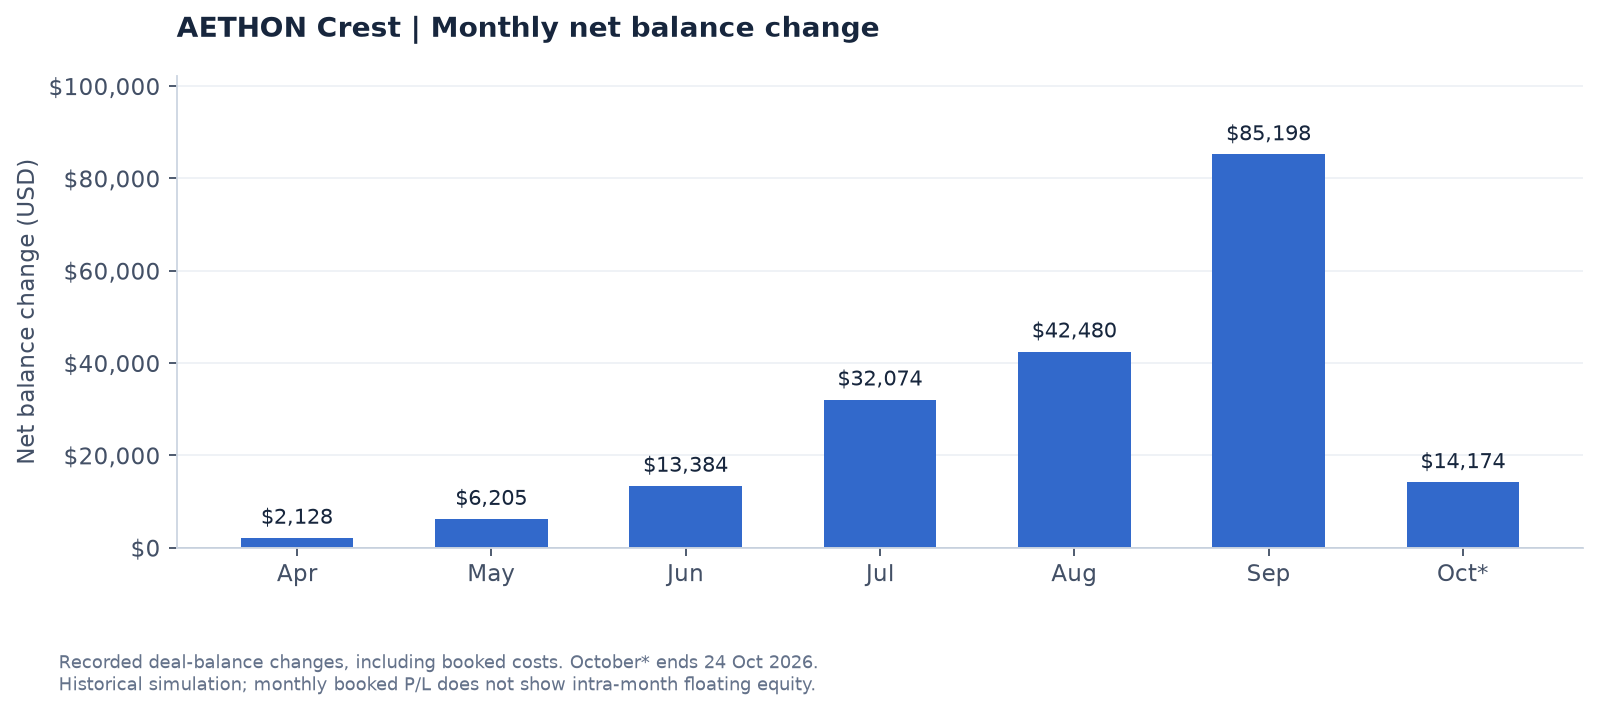
Crest's balance graph is reconstructed from the deal-history balances in the saved report. It shows how reported balance changed as trading activity was booked to the simulated account. It does not reproduce the complete floating-equity path between deals. The monthly chart groups changes in reported balance by calendar month, including recorded trading costs. Together, the charts make the result easier to inspect without suggesting that open positions always tracked the smoothness or direction of the balance curve.
The test span is shorter than a full year, and the October portion ends on 24 October. The displayed percentage is a return over that actual span, not an annualised figure. It should also not be interpreted as a return that every Crest configuration would have produced. Lot sizing, model files, the installed build and execution settings all affect the result. The report demonstrates what happened in one identified simulation; it does not establish a ranking against every gold EA on the market.
A strong technical proposition for a considered shortlist
Crest is suited to traders who want a gold system with a detailed directional model and explicit position management. Its two ensembles, hourly evaluation and three-Wave framework provide concrete reasons to examine it alongside other premium MT5 products. The combination of partial profit-taking and trailing management gives the strategy a defined approach after entry. Buyers can assess those features against their preferred trading rhythm, exposure limits and willingness to tolerate a substantial drawdown.
Explore Crest by reviewing the strategy, the saved settings and the full performance context together. The impressive simulated profit deserves attention, and so does the recorded equity decline. A purchase decision is better informed when both are visible. Crest offers a technically substantial approach to automated gold trading, supported here by a traceable tester report and graphs derived from that report. Any live deployment should be evaluated on the exact build, account conditions and configuration that will actually be used.
Saved report at a glance
| Starting deposit | $10,000.00 |
|---|---|
| Net profit | $195,641.73 |
| Return on initial deposit | 1956.42% |
| Profit factor | 1.82 |
| Trades | 945 |
| Profitable trades | 81.27% |
| Maximum relative equity drawdown | 33.11% |
Historical simulation: 1 April–24 October 2026. History quality is labelled 100% real ticks in the report.
Interested in Aethon Crest?
Tell us your broker and account size. We'll reply with the price, the recommended settings and a licence key for your MT5 account number.