
Analysis8 min read
Best indicators for crypto and forex technical analysis (and how to use them)
The best indicators answer one clear question each, about trend, momentum or volatility. How to use them without cluttering your chart.

The best indicators for crypto trading each answer one plain question: is the market trending, how strong is the move, and how far does price normally travel in a day? Most traders need two or three of them, not ten. Below are the trend, momentum, volatility and volume tools worth knowing, with settings you can test. Everything here applies to forex too.
Best indicators for crypto trading: a simple combination
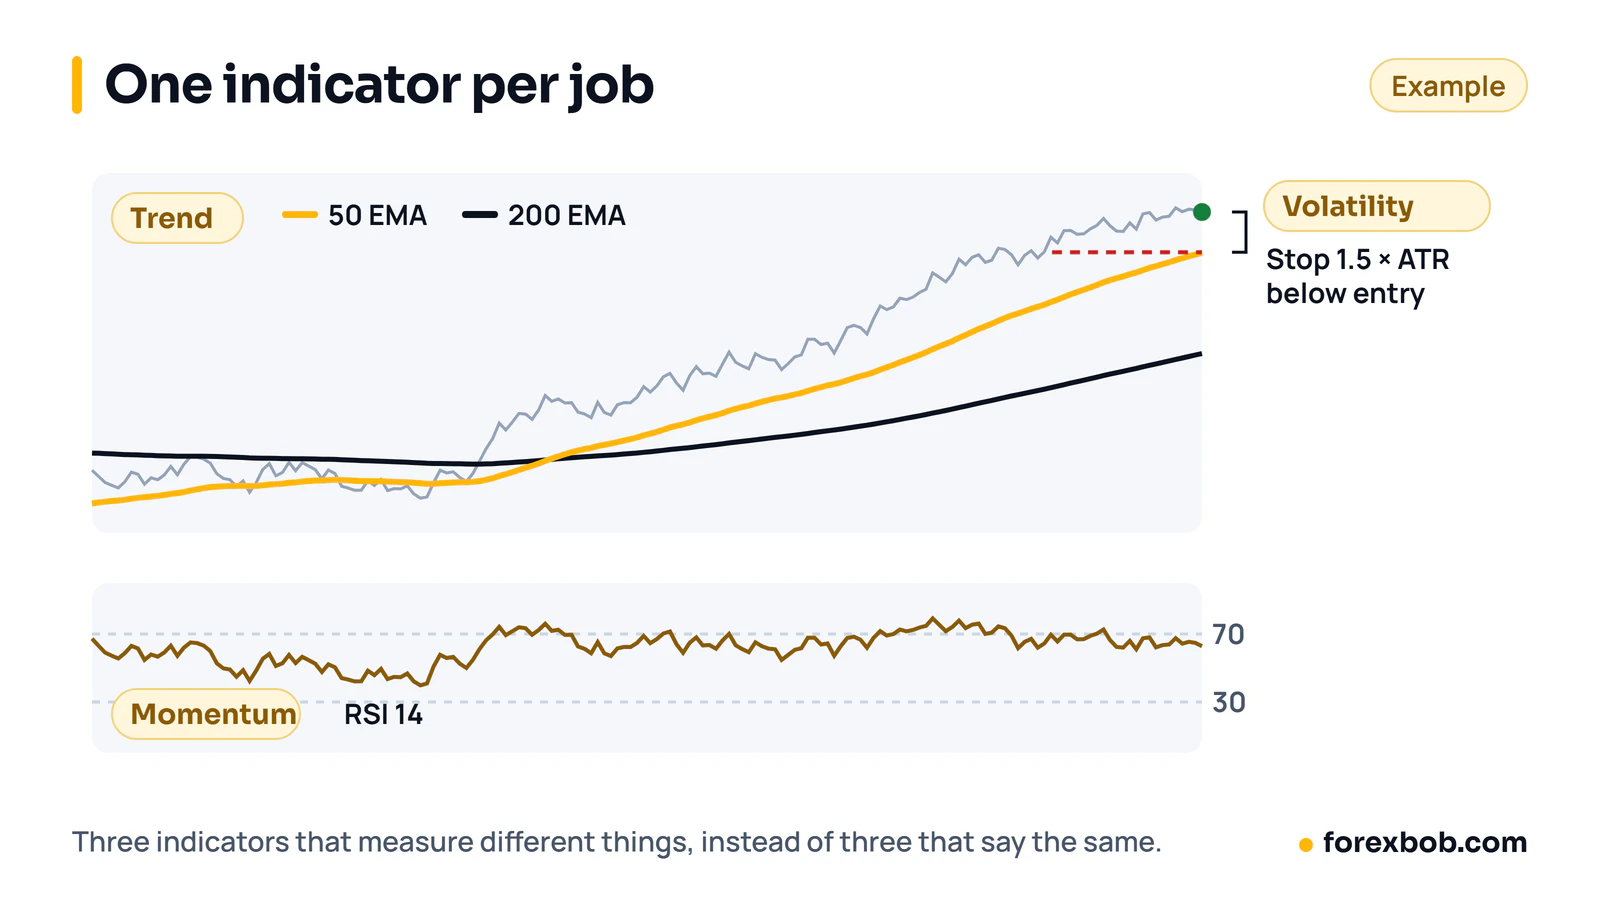
A useful set covers three different jobs, not three versions of the same job: one tool for trend, one for momentum and one for volatility, so you can place a sensible stop. A common starting set is a 50-period moving average for trend, RSI for momentum and ATR for stop distance.
Start with that set on demo or in replay before you add anything else, and watch how it behaves in a trend, in a range and around news. If you cannot explain in one sentence what each indicator adds, remove it.
Trend indicators: moving averages
A moving average smooths past prices into a single line, so you can see direction without reacting to every candle. Price above a rising average points to an uptrend, price below a falling average points to a downtrend, and repeated crossings often mean a ranging market where trend signals are less reliable.
Simple and exponential moving averages
A simple moving average (SMA) gives every price in its period equal weight, so a 50-period SMA is the average of the last 50 closing prices. An exponential moving average (EMA) gives more weight to recent prices, so it reacts faster. Many traders use a 20- or 50-period EMA for shorter-term direction and a 200-period average for the longer-term trend.
The 200-period average works better as a filter than as a precise entry signal. For example, you might only look for long trades when price is above it on the daily chart. That rule keeps you out of many trades against the main trend, though price can still reverse after crossing it.
Moving average crossovers
A crossover happens when a shorter average crosses a longer one, such as the 50-period EMA crossing above the 200-period EMA, which traders read as a shift towards an uptrend. Crossovers lag by design, because they are built from past prices, so they often confirm a move after it has started and give repeated false signals in a sideways market.
Momentum indicators: RSI and MACD
Momentum indicators measure how fast price has moved, not just which way. They help you spot when a move may be stretched or when pressure is fading, but they do not predict reversals on their own and can stay stretched for a long time in a strong trend.
Relative strength index (RSI)
The RSI is usually set to 14 periods and moves between 0 and 100. Readings above 70 are often called overbought, and below 30 oversold, but those labels describe recent strength, not a promise that price will turn. In a strong uptrend, RSI can stay above 70 while price keeps rising.
RSI is most useful at a level you already care about. If price pulls back to a rising 50-period EMA and RSI dips towards 40–50 before turning up, that can support a long idea in an uptrend. Divergence, where price makes a new high while RSI makes a lower high, warns that momentum is fading, so wait for confirmation before acting on it.
Moving average convergence divergence (MACD)
The MACD is built from two exponential moving averages, usually 12 and 26 periods, with a 9-period signal line. A cross above the signal line means short-term momentum has turned up, and a cross below means it has turned down. A shrinking histogram can show momentum fading before a cross happens.
MACD and RSI both measure momentum, so using both at full weight can double-count the same idea. If MACD is your momentum tool, use RSI only for pullback timing, if at all. Keep the standard 12, 26 and 9 settings while you learn, since changing settings to fit past price often makes a tool worse on new data.
Volatility indicators: ATR and Bollinger Bands
Volatility indicators tell you how much price normally moves, which matters for stop placement and position size. A stop too tight for normal movement will be hit by ordinary noise, while a stop far too wide risks more than you planned.
Average true range (ATR)
The ATR is usually set to 14 periods and measures the average size of recent price ranges, including gaps. It is not a direction signal. If the 14-period ATR on the EUR/USD daily chart is 0.0080, recent daily ranges have averaged about 80 pips, and a stop based on a quieter period may be too tight now.
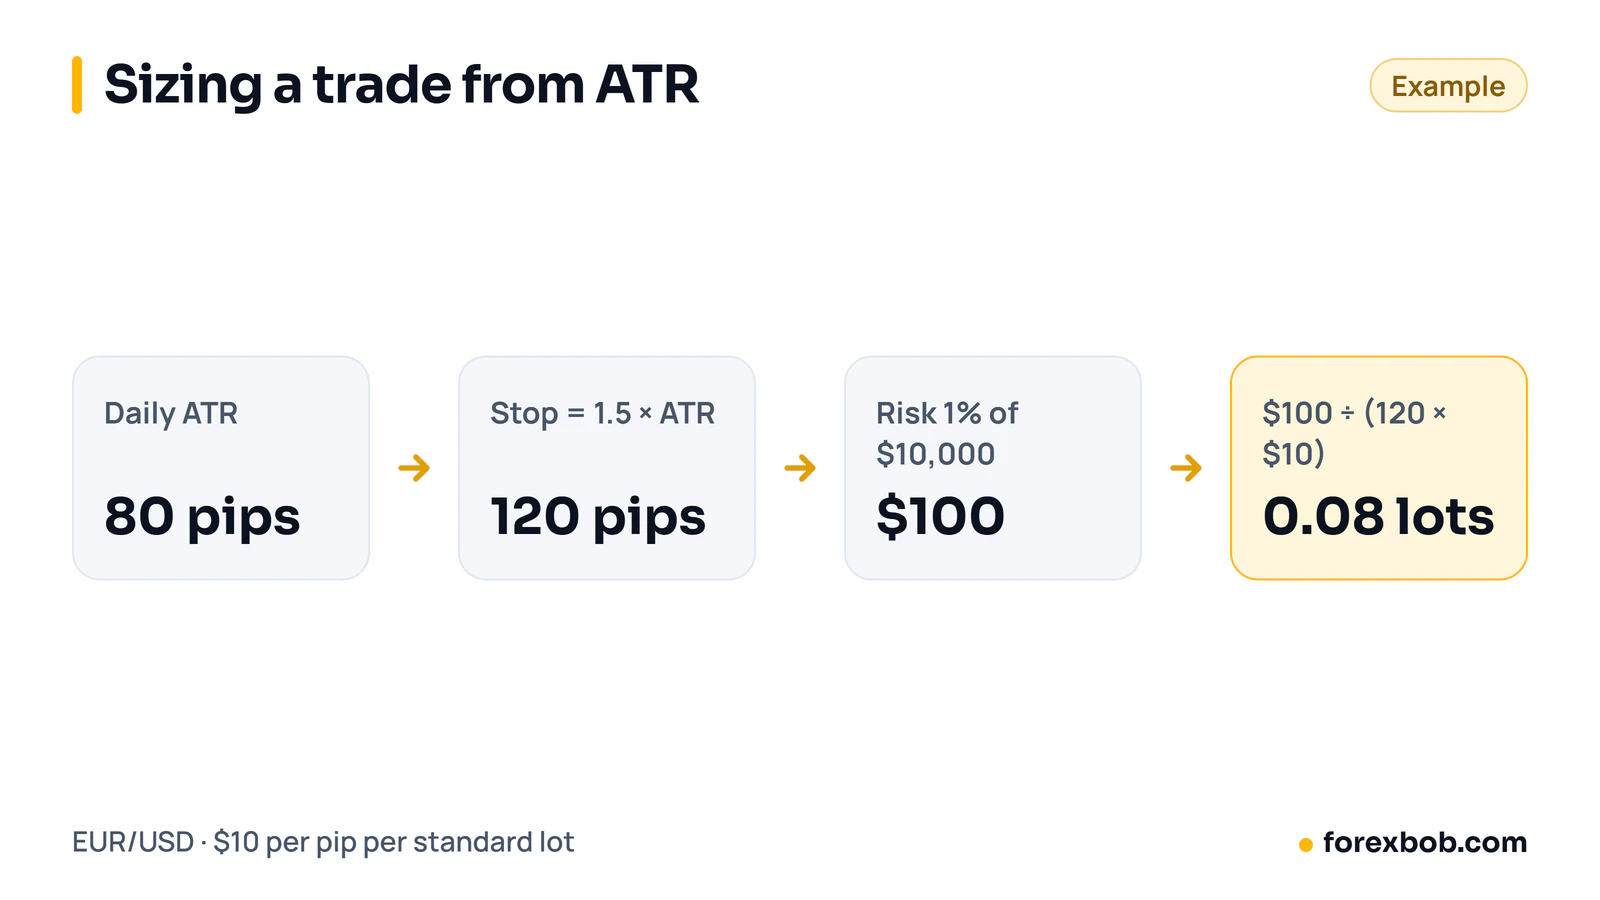
A common method is to set the stop as a multiple of ATR, such as 1.5 × ATR. Here is a worked example on EUR/USD with a $10,000 account:
- The daily ATR is 80 pips, so the stop is 1.5 × 80 = 120 pips.
- Risking 1% gives 1% × $10,000 = $100.
- One pip on a standard lot of EUR/USD is worth about $10, so one lot with a 120-pip stop risks 120 × $10 = $1,200.
- Your size is $100 ÷ $1,200 = 0.083 lots, rounded down to 0.08 lots.
You can check the maths with the calculator at the end of this article. For more on choosing the level itself, see where to place a stop loss.
Bollinger Bands
Bollinger Bands place a 20-period moving average in the middle, with bands two standard deviations above and below it. They widen when volatility rises and narrow when it falls, and price touching a band does not mean it must reverse.
Bollinger Bands are most useful for reading the state of the market: narrow bands after a quiet period can warn that a larger move may be coming, though they do not say which way.
Volume indicators and the spot forex caveat
Volume shows how much trading activity sits behind a move. A rise on rising volume often carries more conviction than a rise on very low volume, and a breakout on low volume is easier to reverse. The data you get depends on the market you trade, and this is where forex and crypto differ.
On a crypto exchange, the volume shown is what traded on that exchange, so it differs from one exchange to another. In spot forex there is no central exchange, so no true total volume exists. Many forex platforms show tick volume, which counts price changes rather than the amount traded, so treat it only as a rough gauge of activity.
Why more indicators is not better
Adding indicators feels like adding evidence, but it often adds the same evidence twice. RSI, the stochastic and MACD all measure momentum, so their agreement often just repeats one idea, and the same goes for three moving averages of similar length. That creates false confidence: you think three independent signals agree when only one idea is being measured three ways.
More indicators also slow decisions and make backtesting harder, since every extra rule adds a chance to fit the set to past prices by accident. Hide each indicator in turn and ask whether your decision changes. If removing it does not change your entry, exit or size, it is decoration. You can add a tool back later for a specific job, such as using the Fibonacci retracement guide to map pullback levels.
We put this to a hard test on gold: all 90 of TradingView's built-in indicators, and 772 combinations of them, used as entry signals on XAU/USD. None did better than chance once we allowed for how many we had tried. Indicators help you read the chart and set a sensible stop. On their own, they are not an edge.
Indicator mistakes
- Using several momentum indicators at once and treating their agreement as confirmation, when they measure the same thing.
- Selling only because RSI is above 70, or buying only because it is below 30, while the trend is strong in the other direction.
- Using the same fixed stop distance for EUR/USD, GBP/USD and XAU/USD, despite very different daily ranges.
- Changing settings after every losing trade until the past chart looks perfect, which usually makes live results worse.
- Trading crossovers in a sideways market without a range filter, then blaming the indicator for whipsaws.
- Treating tick volume in spot forex as true traded volume, and building strict rules on a proxy number.
FAQ
What are the best indicators for crypto trading for beginners?
Start with a 50-period moving average for trend, a 14-period RSI for momentum and a 14-period ATR for stop distance. Learn how each behaves in trends and ranges before you add a fourth tool.
What are the best technical indicators for forex?
The same core set works for forex: moving averages for trend, RSI or MACD for momentum, and ATR for stops. Be careful with volume, because spot forex has no central volume feed and tick volume is only a proxy.
What are the best RSI and MACD settings?
The standard settings are a good starting point: RSI at 14 periods, and MACD at 12, 26 and 9. If you change them, test on fresh data you did not use to choose the setting, so you do not tune the tool to past noise.
Should I use Bollinger Bands or ATR for stop losses?
ATR is usually simpler for stops, because it gives one number for the normal range that you can multiply, such as 1.5 × ATR. Bollinger Bands are better for reading volatility, so use ATR for the stop and Bollinger Bands for context.
How many indicators should I use on one chart?
Two or three that do different jobs are enough: one for trend, one for momentum and, optionally, one for volatility. If a fourth indicator does not change your entry, exit or size, it is not helping.
For the platforms to chart them on, read our guide to the best charting software for crypto and forex. If your tested idea becomes clear rules, our EA development service can turn those rules into an Expert Advisor for MT4 or MT5, tested in the Strategy Tester and on demo before delivery.
Keep reading: best crypto charting software, where to place a stop loss and the Fibonacci retracement guide.
Risk note: trading forex carries a high level of risk and may not be suitable for everyone. This article is for education only and is not financial advice.
Position size
0.40 lots
40,000 units
Amount at risk
$100.00
Pip value (1 lot)
$10.00
Mini lots
4.0
Micro lots
40
Have a strategy you want automated?
We turn trading rules into tested Expert Advisors for MT4 and MT5. Tell us how you trade and we'll send a specification and a quote.
More articles
Automated trading8 min read
What is an Expert Advisor (EA) and how does it work?
An Expert Advisor is a program that trades for you in MetaTrader from rules you set. How it works, what it can and can't do, and how to judge one.
Read article
Automated trading8 min read
How to turn your trading strategy into an EA
Turn a trading idea into exact EA rules, test it properly and hire a developer with confidence: the specification, the testing and the red flags.
Read article
Automated trading8 min read
Forex VPS for EAs: do you need one, and how to set it up
A forex VPS keeps your Expert Advisor running when your own computer is off. When you need one, how much power it needs and how to set it up.
Read article