
Risk management7 min read
Risk of ruin in trading: how likely is it you'll blow your account?
Risk of ruin is the chance that a run of losses wipes out your account before your edge can play out. Smaller risk per trade and a hard drawdown stop cut it sharply.
Risk of ruin in trading is the chance that losses shrink your account to a point where you cannot recover, or where you stop trading, before any edge in your method has time to play out. It is not a prediction that you will fail, and it depends mainly on three inputs: how much you risk per trade, how often you win, and how large your wins are compared with your losses.
Why recovery gets harder as you lose
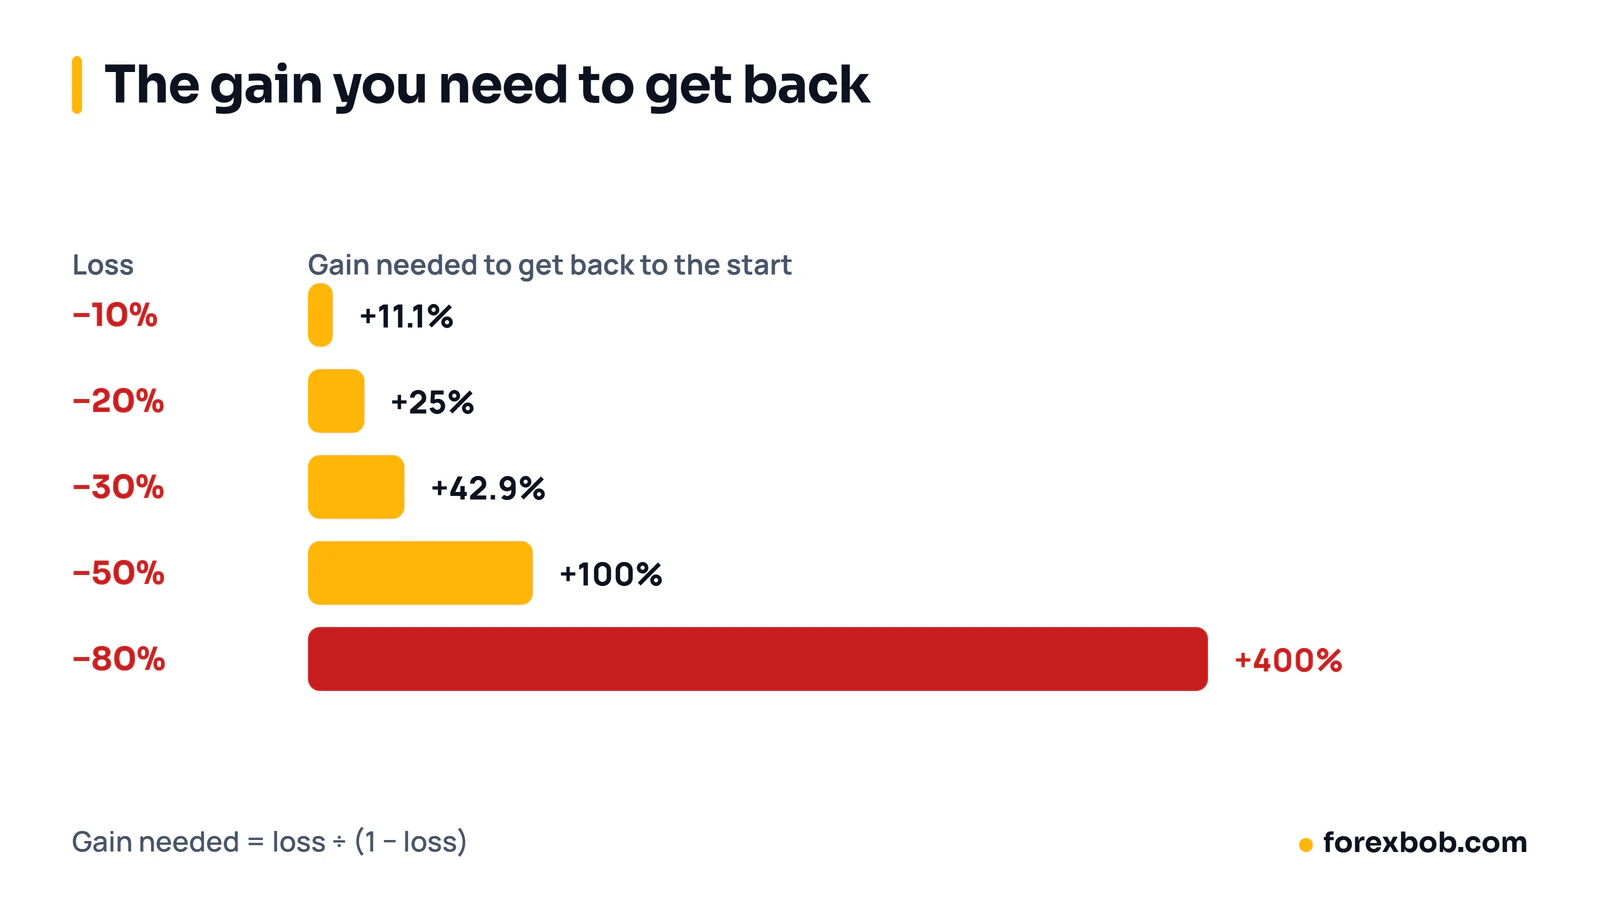
Think of risk of ruin as the risk of running out of room. Every trade risks a slice of your account, and a run of losses shrinks what remains, so the gain needed to recover grows. A 10% loss needs an 11.1% gain: $100 minus 10% leaves $90, and $10 ÷ $90 = 11.1%. A 50% loss needs a 100% gain, because $50 must double to get back to $100.
That recovery maths is why risk of ruin matters more than any single trade. A method can be sound over hundreds of trades and still fail if a normal losing streak takes the account too low to continue. Survival comes first, because you need to stay in the game long enough to find out whether your method works.
What drives risk of ruin: risk, win rate and reward
Three factors drive risk of ruin:
- Risk per trade, as a percentage of your current account.
- Win rate, the share of trades that win.
- Reward-to-risk, how much you make on a win compared with what you lose on a loss.
A higher win rate and a higher reward-to-risk both lower risk of ruin, while a higher risk per trade raises it sharply.
Risk per trade has the largest effect because it controls how fast a streak eats your account. Going from 1% to 2% compounds across a streak, so the account falls faster with each loss. Win rate matters too, but traders often overestimate it because they remember winners and forget losers. A hypothetical method that wins 40% of its trades still loses 60% of them, so losing streaks are normal.
Reward-to-risk decides how many wins you need to offset losses. At 1:1, risking $100 to make $100, you need to win more than half your trades to break even before costs. At 2:1, risking $100 to make $200, each win offsets two losses. Costs make the real break-even point slightly harder. For background, see how much to risk per trade and risk-reward ratio vs win rate.
Worked example: 1%, 2%, 5% and 10% risk
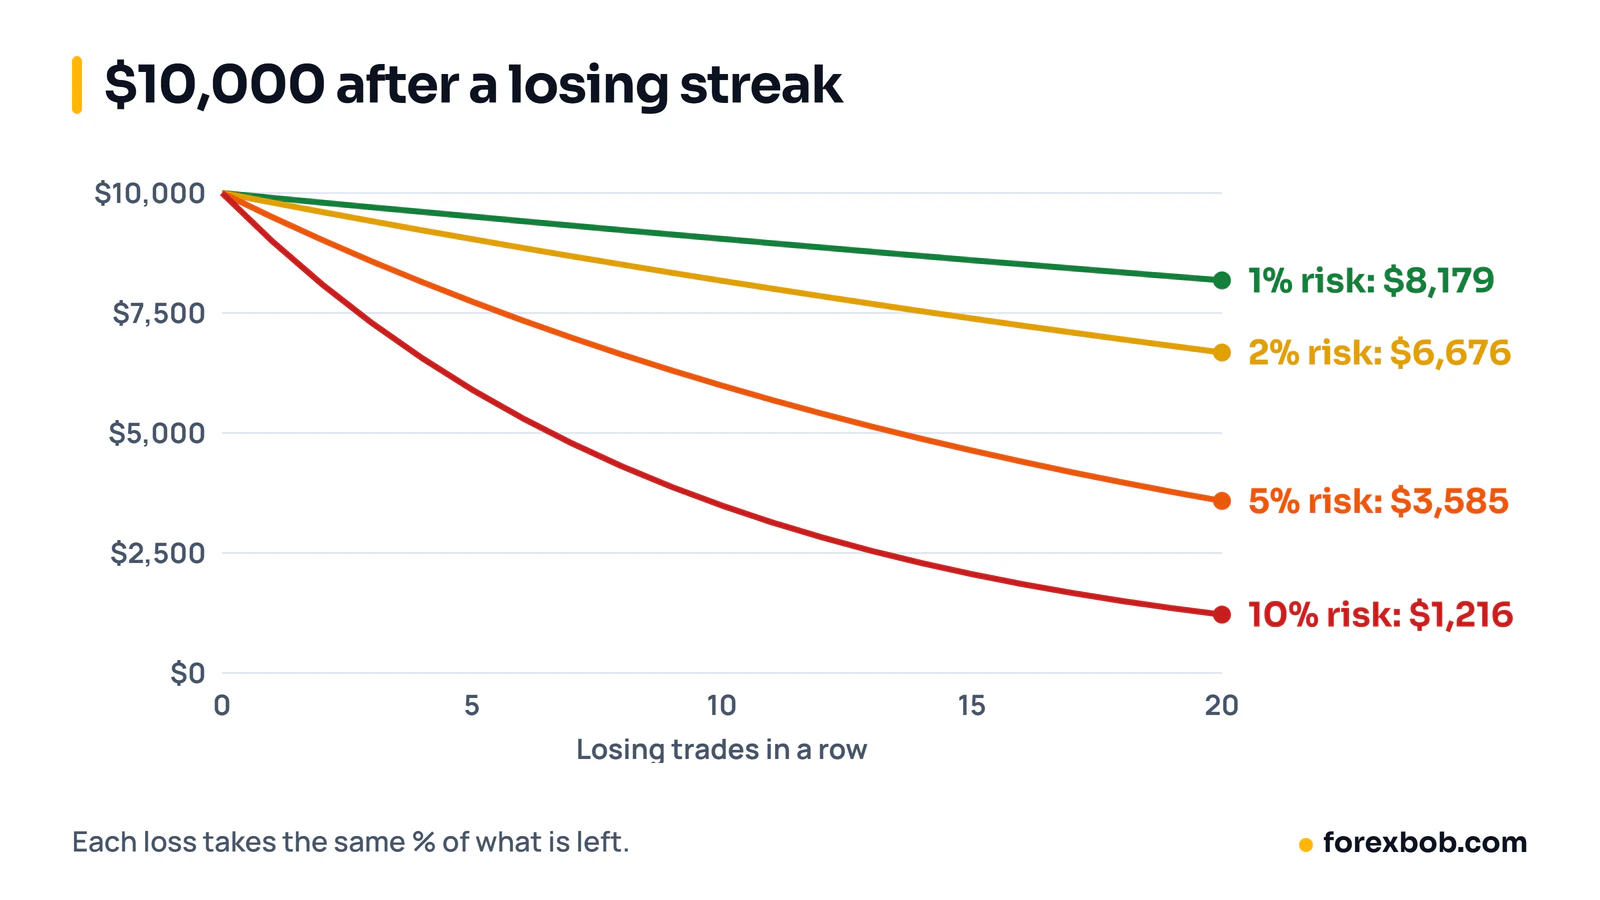
This example uses simple maths and is an illustration, not a forecast for any real method. It starts with a $10,000 account and fixed percentage risk, so the dollar risk falls as the account falls. After N losses in a row at risk r, the account left is $10,000 × (1 − r) to the power N.
After 10 losses in a row:
- At 1% risk: $10,000 × 0.9044 = $9,044, a 9.6% loss
- At 2% risk: $10,000 × 0.8171 = $8,171, an 18.3% loss
- At 5% risk: $10,000 × 0.5987 = $5,987, a 40.1% loss
- At 10% risk: $10,000 × 0.3487 = $3,487, a 65.1% loss
After 20 losses in a row:
- At 1% risk: $8,179 left, an 18.2% loss
- At 2% risk: $6,676 left, a 33.2% loss
- At 5% risk: $3,585 left, a 64.2% loss
- At 10% risk: $1,216 left, an 87.8% loss
Compounding makes the high-risk account fall much faster, and recovering from 87.8% down needs a gain of about 722%, since $1,216 must grow back to $10,000.
You can also look at the chance of the streak itself. Take a hypothetical method that wins 40% of trades and loses 60%. If each trade were independent, the chance that the next N trades all lose is 0.60 to the power N: about 7.8% for 5 losses (0.0778), 1.7% for 8 losses (0.0168) and 0.6% for 10 losses (0.0060).
Those are the odds for one particular run of trades. Over hundreds of trades, the chance of meeting a long streak somewhere is much higher, as our guide to how many losing trades in a row is normal shows. Real trades are also not fully independent, so treat all of these numbers as illustrations, not exact ruin probabilities. Size each trade with the calculator at the end of this article.
Why losing streaks matter more than you expect
Losing streaks feel rare when you are winning, and endless when you are in one. Both feelings mislead. Even a method that wins half its trades will produce runs of losses, because random sequences cluster: toss a coin ten times and you will often see three or four of the same result in a row. Market conditions can make losses cluster even more, for example when a trend method keeps trading in a ranging market.
That clustering is why a trader can be right about the long run and still blow an account in the short run. At 10% risk, a 10-loss streak leaves about a third of your account, and you may stop trading or raise your risk to recover faster, which raises the risk of ruin further. At 1% risk, the same streak leaves you down less than 10%, which is painful but survivable.
Streaks also affect decisions, not just your balance. After several losses, many traders widen stops or double their size to win the losses back quickly, which breaks the assumptions behind any risk calculation. A risk plan only works if you follow it during a streak, when it is hardest to follow. That is why a written daily loss limit and a maximum drawdown stop matter as much as the percentage you choose. Our guide to drawdowns and losing streaks covers this in more depth.
Practical limits that lower risk of ruin
- Low fixed risk per trade. Many guides suggest 1% or less for beginners, and 2% as an upper range for tested methods. If a 20-loss streak at your chosen risk would leave you unable to continue, your risk is too high.
- A daily loss limit. For example, stop trading for the day after losing 3% of your account, so one bad day does not turn into a revenge-trading session. Write it down and close the platform when you hit it.
- A maximum drawdown stop. For example, pause live trading and go back to demo if the account falls 20% from its peak. The pause lets you review whether the method, the market or your execution has changed, without risking more while you are unsure.
- No extra risk after losses. Do not double your size, move a stop further away or add to a losing trade unless that was part of your tested plan from the start. If your plan says risk 1%, risk 1% on the next trade as well.
Hard stops work in code too. When we stress-tested one of our own grid EAs on six bad price paths, the original version wiped the account on at least one of them. With a 20% equity stop added, none wiped, and the worst drawdown was about 24%.
Sizing mistakes that raise risk of ruin
- Risking 5% or 10% per trade after early wins, then meeting a normal streak with too little room left.
- Assuming a high win rate from a short run of winners, then sizing for a win rate not shown over many trades.
- Judging a method by win rate alone, even when the average loss is larger than the average win.
- Treating a streak probability from a simple example as an exact forecast, when real trades are not independent.
- Increasing size after losses to recover faster, which raises risk of ruin just when the account is already down.
- Trading without a daily loss limit, so one bad session can lose more than a full week of normal risk.
- Changing methods mid-drawdown without a review, so you cannot tell which method caused the result.
FAQ
How do I calculate risk of ruin?
A simple version: the account lost after N losses in a row at fixed risk r is 1 − (1 − r) to the power N, and the chance that the next N trades all lose is the loss rate to the power N. Treat any result as an illustration, not an exact prediction.
Is risking 1% per trade safe?
Risking 1% per trade lowers risk of ruin sharply compared with 5% or 10%, but no risk level is safe in an absolute sense. Its benefit is survival: a normal losing streak leaves most of your account intact.
How many losing trades in a row should I plan for?
Plan for a streak longer than the worst you have seen so far. If your worst streak is 8 losses, check that you could survive 12 or 15, and lower your risk or add a drawdown stop if that streak would stop you trading.
Does a higher win rate remove risk of ruin?
No. A higher win rate lowers risk of ruin, but it does not remove it. Even a hypothetical method that wins 60% of its trades still loses 40% and will produce streaks, so a high risk per trade can still lead to ruin.
If you want a daily loss limit and a drawdown stop enforced automatically, our EA development service can build them into an Expert Advisor for MT4 or MT5.
Keep reading: how much to risk per trade, how many losing trades in a row is normal and how to recover from a drawdown.
Risk note: trading forex carries a high level of risk and may not be suitable for everyone. This article is for education only and is not financial advice.
Position size
0.40 lots
40,000 units
Amount at risk
$100.00
Pip value (1 lot)
$10.00
Mini lots
4.0
Micro lots
40
Have a strategy you want automated?
We turn trading rules into tested Expert Advisors for MT4 and MT5. Tell us how you trade and we'll send a specification and a quote.
More articles
Automated trading8 min read
What is an Expert Advisor (EA) and how does it work?
An Expert Advisor is a program that trades for you in MetaTrader from rules you set. How it works, what it can and can't do, and how to judge one.
Read article
Automated trading8 min read
How to turn your trading strategy into an EA
Turn a trading idea into exact EA rules, test it properly and hire a developer with confidence: the specification, the testing and the red flags.
Read article
Automated trading8 min read
Forex VPS for EAs: do you need one, and how to set it up
A forex VPS keeps your Expert Advisor running when your own computer is off. When you need one, how much power it needs and how to set it up.
Read article