
Order block trading: how to find order blocks, and what testing shows
What an order block is, how to mark bullish and bearish ones, where to enter and put the stop, and the results when we tested an order block indicator on gold.
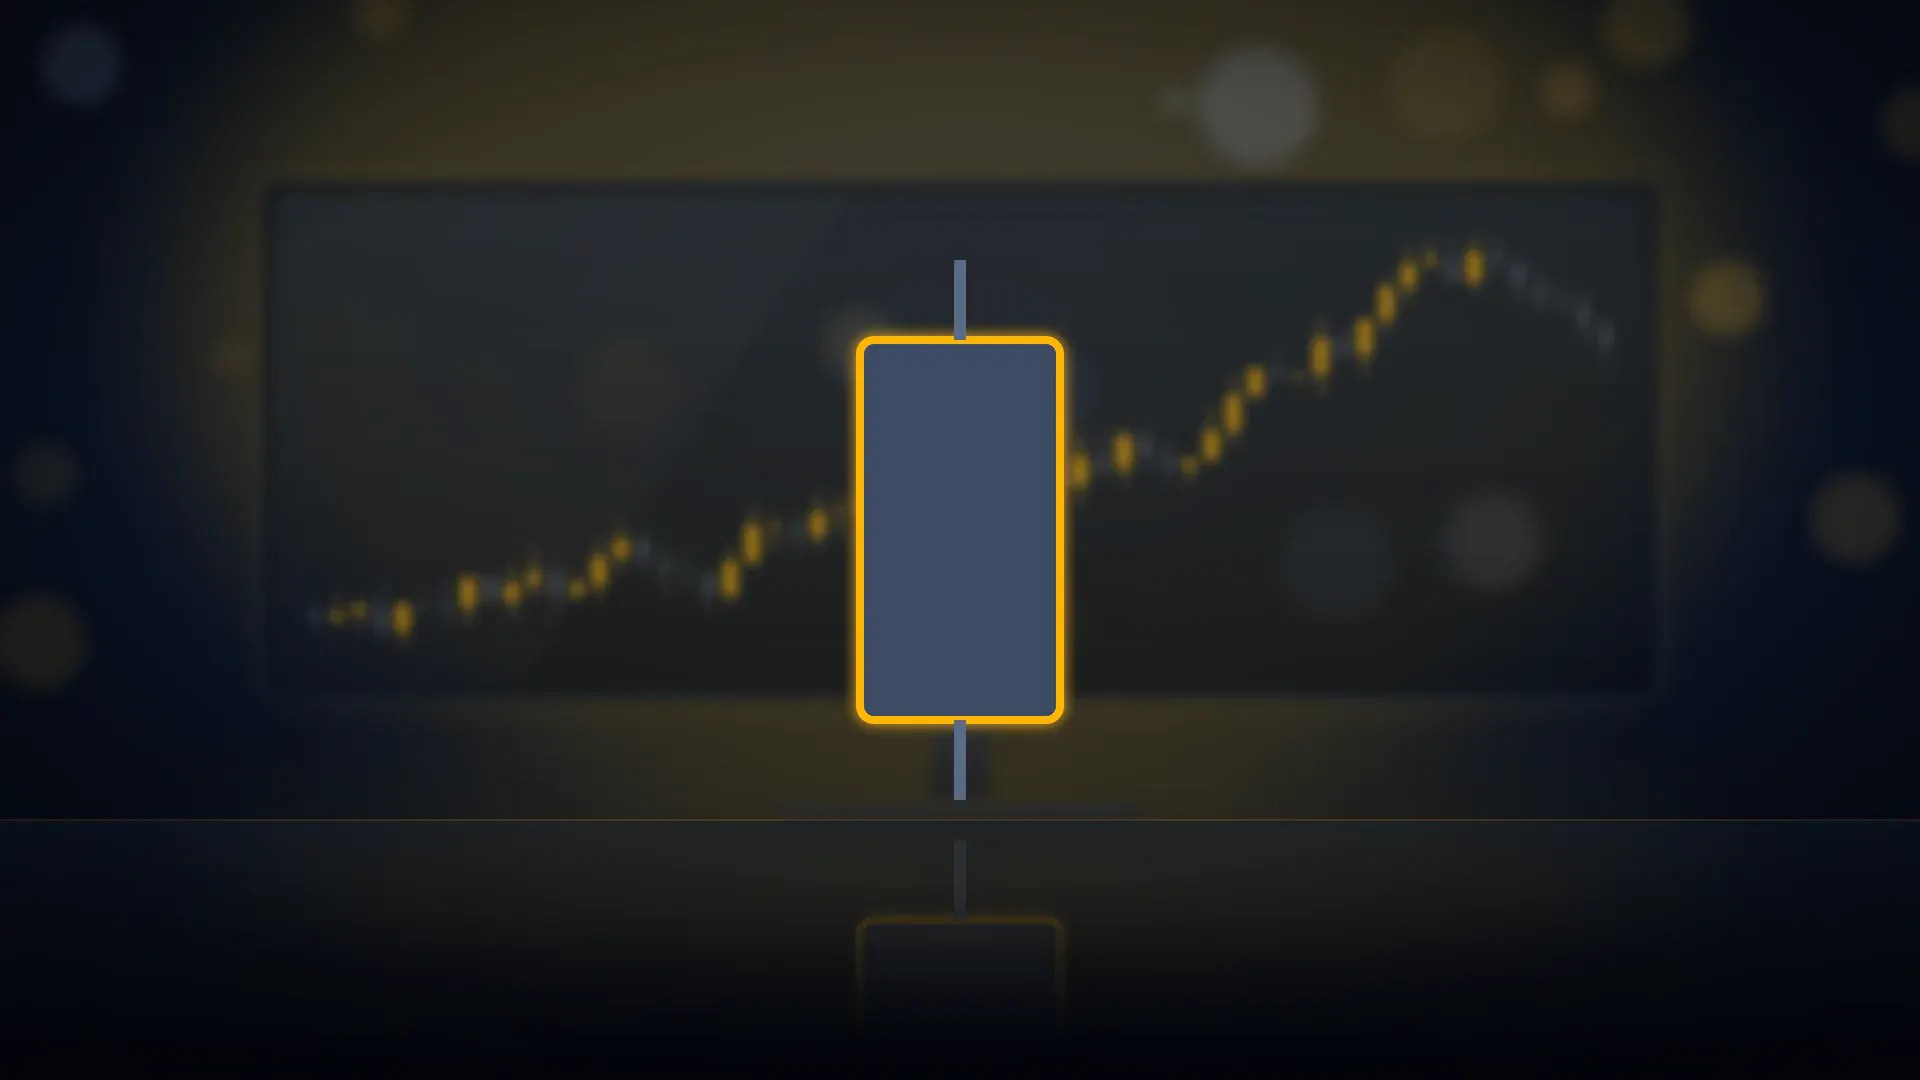
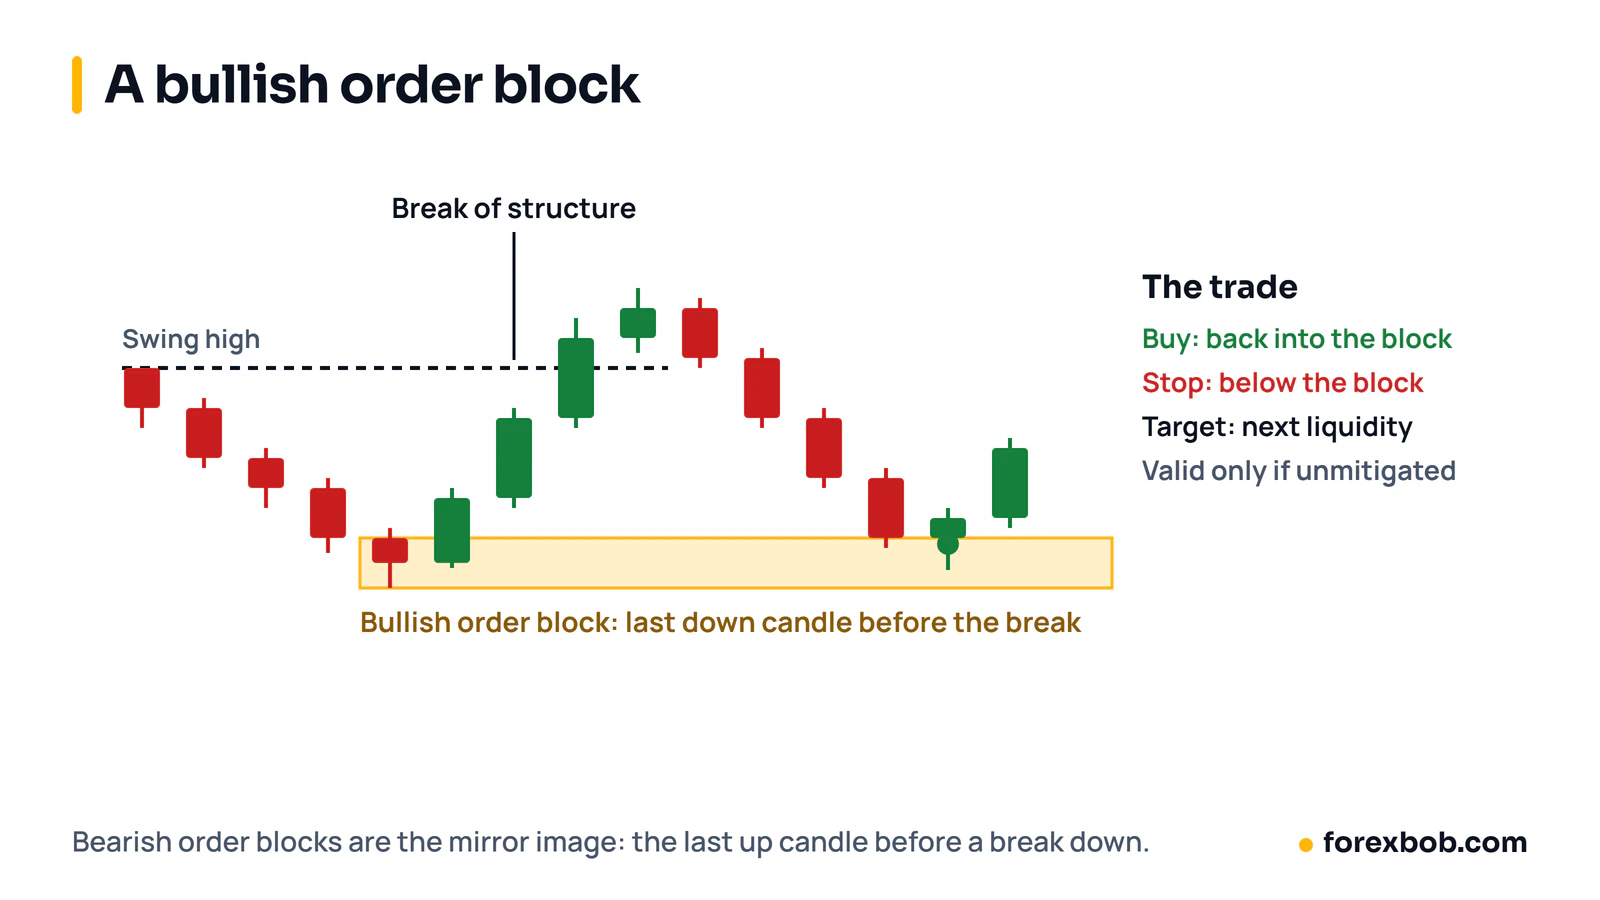
An order block is the last opposite-coloured candle before a strong move that breaks market structure. A bullish order block is the last down candle before a sharp rally. A bearish order block is the last up candle before a sharp fall.
The theory is that large traders built their position in that candle, and that part of their order was left unfilled. When price returns to the block, those orders may push it away again. Order blocks are a big part of smart money and ICT trading, and they are close cousins of supply and demand zones.
Bullish and bearish order blocks
- Bullish order block: the last bearish candle before a strong move up that breaks above a recent swing high. Traders look to buy when price comes back down into it.
- Bearish order block: the last bullish candle before a strong move down that breaks below a recent swing low. Traders look to sell when price comes back up into it.
How to find a valid order block
Most order block traders look for three things together:
- A break of structure. The move away from the block must break a recent swing high (for bullish blocks) or swing low (for bearish ones). Without that, it is just a candle before a move.
- Displacement. The move should be fast, with large candles. Many traders also want it to leave a fair value gap, a three-candle gap where the first candle's high and the third candle's low don't overlap.
- Unmitigated. Price has not come back into the block since it formed. Once it has, the block is called mitigated and most traders stop using it.
How to mark it
Traders disagree on this, which is worth knowing because it changes your entry and stop. Some mark the whole candle including wicks. Some use just the body. Some use the open of the candle to the 50% level. Pick one method and use it every time, or your results will be impossible to judge.
Entries and stops
The usual entry is a limit order at the near edge of the block, or at its 50% level. The stop goes beyond the far edge, with a buffer. A common target is the next opposing liquidity, such as the previous swing high or an area of equal highs.
Because blocks are small, the stop is often tight and the risk-reward can look excellent: 1:3 or more. The catch is the win rate. At 1:3 you need to win more than 25% of trades just to break even before costs, so a strategy that wins 27% of the time is barely scraping by.
Order blocks vs supply and demand
Both mark areas where price left fast. The differences are in the detail. An order block is a single candle, and it must come with a break of structure. A supply or demand zone covers the whole base and doesn't need a structure break. In practice, many order blocks sit inside a supply or demand zone drawn on the same move.
What testing showed
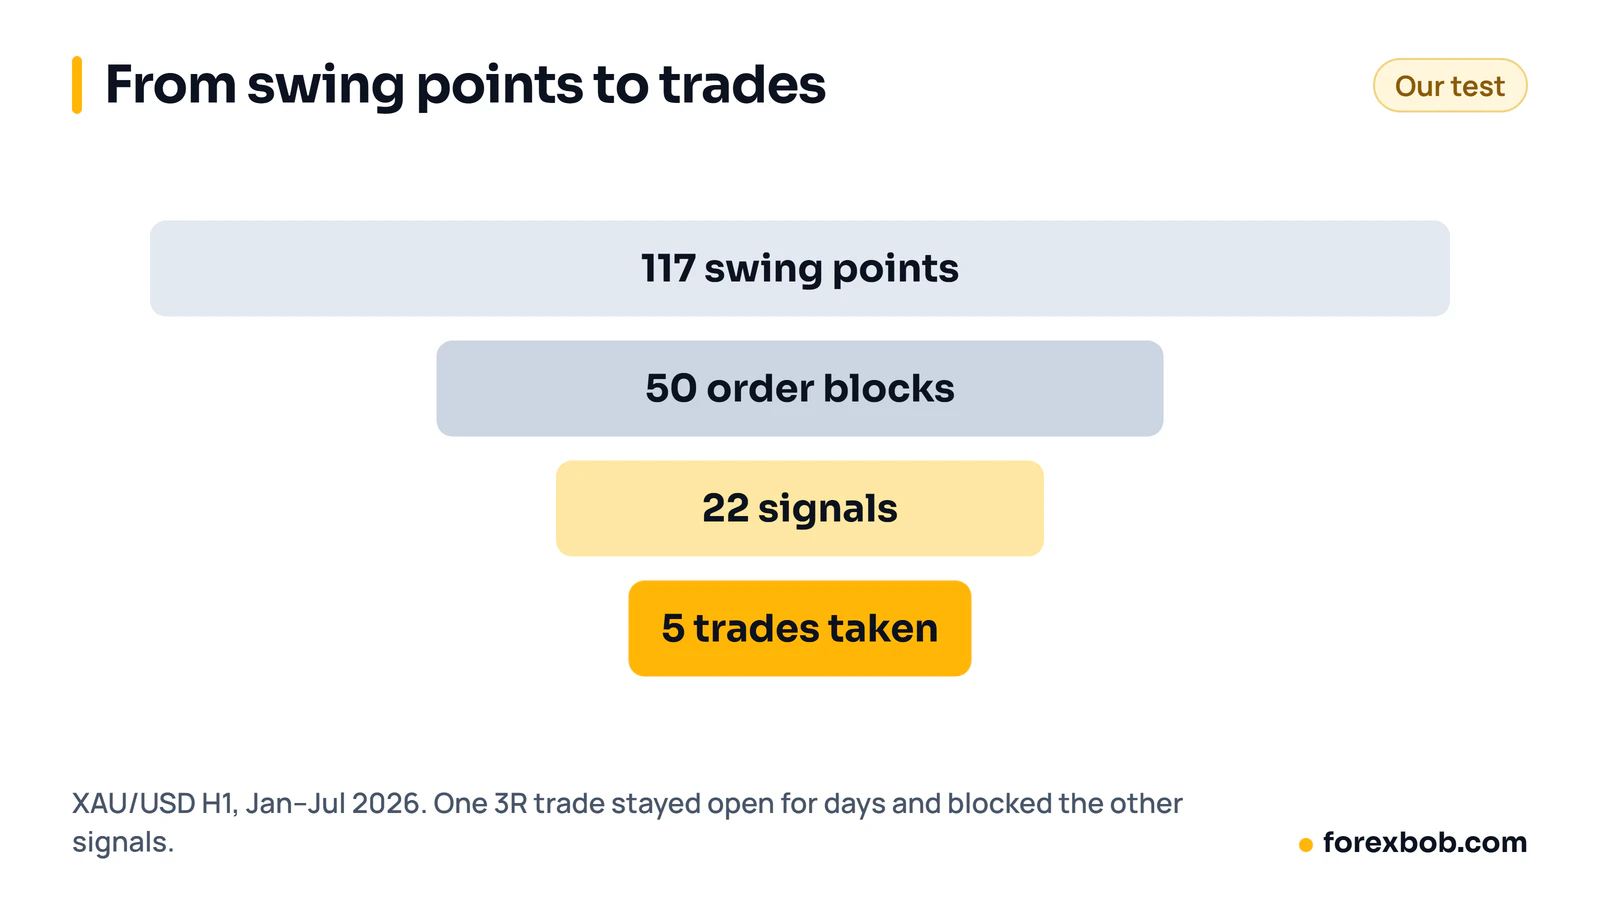
We tested an order block indicator for gold from TradingView. It finds swing points, builds blocks after a structure break, grades them, and signals when price retests a block. We coded the same rules as a strategy and ran six months of XAU/USD, January to July 2026, with spread and commission included.
On the hourly chart the indicator found 117 swing points, built 50 order blocks and gave 22 trade signals. But only 5 trades were actually taken. With a 3R target and no time limit, one trade stayed open for days, and the strategy ignored every signal that came while it was in a trade.
So we tested again, taking every signal with the same risk:
- 15-minute chart: 80 trades, 30% won, profit factor 1.13, +8.9R in total. But the worst drawdown was 14.1R, bigger than the whole profit.
- Hourly chart: 23 trades, 26% won, profit factor 0.64, −6R.
Both sit right on the 25% line a 3R target needs. Six months is far too short to call it an edge either way, and the drawdown on the better version would test anyone's patience. What it does show is that a chart full of nice-looking blocks says little about results until you count the trades.
Common mistakes
- Calling any candle an order block. No structure break, no block.
- Changing how you mark blocks from trade to trade. Wick, body or 50% changes your entry and stop. Fix one rule.
- Forgetting the spread on tight stops. A 30-cent spread on gold matters a lot when the stop is $2 away.
- Judging by the indicator's own labels. Signal labels on a chart are not trades. Count what would actually have been filled, one position at a time if that's how you trade.
Keep reading: supply and demand trading, ICT trading strategy, risk-reward ratio vs win rate and how to judge an Expert Advisor.
Risk note: trading forex carries a high level of risk and may not be suitable for everyone. This article is for education only and is not financial advice.
Have a strategy you want automated?
We turn trading rules into tested Expert Advisors for MT4 and MT5. Tell us how you trade and we'll send a specification and a quote.
More articles

Supply and demand trading: how to mark zones, and what testing shows
How to find supply and demand zones, draw them, enter and place stops. Then what happened when we tested a zone strategy on seven years of EUR/USD.
Read article
Forex risk management: the complete guide
Everything that decides how much you can lose, in one place: risk per trade, sizing, stops, leverage, correlated trades, drawdown limits and the extra risks of EAs.
Read article
Forex prop firms explained: funded accounts, the rules and using EAs
What prop trading is, how forex funded account challenges work, the drawdown rules that end most attempts, what firms allow with EAs, and the maths behind passing.
Read article