
Supply and demand trading: how to mark zones, and what testing shows
How to find supply and demand zones, draw them, enter and place stops. Then what happened when we tested a zone strategy on seven years of EUR/USD.

Supply and demand trading is built on one observation: when price leaves an area fast, there were probably more orders there than the market could absorb. If some of those orders were left unfilled, price may react when it comes back to the same area.
Traders mark these areas as zones, wait for price to return, and trade the reaction. Here is how the zones are drawn, how people trade them, and what we found when we put a zone strategy through a long test.
Supply zones and demand zones
A demand zone is an area price left sharply upwards. The idea is that buyers were waiting there. A supply zone is an area price left sharply downwards, where sellers were waiting.
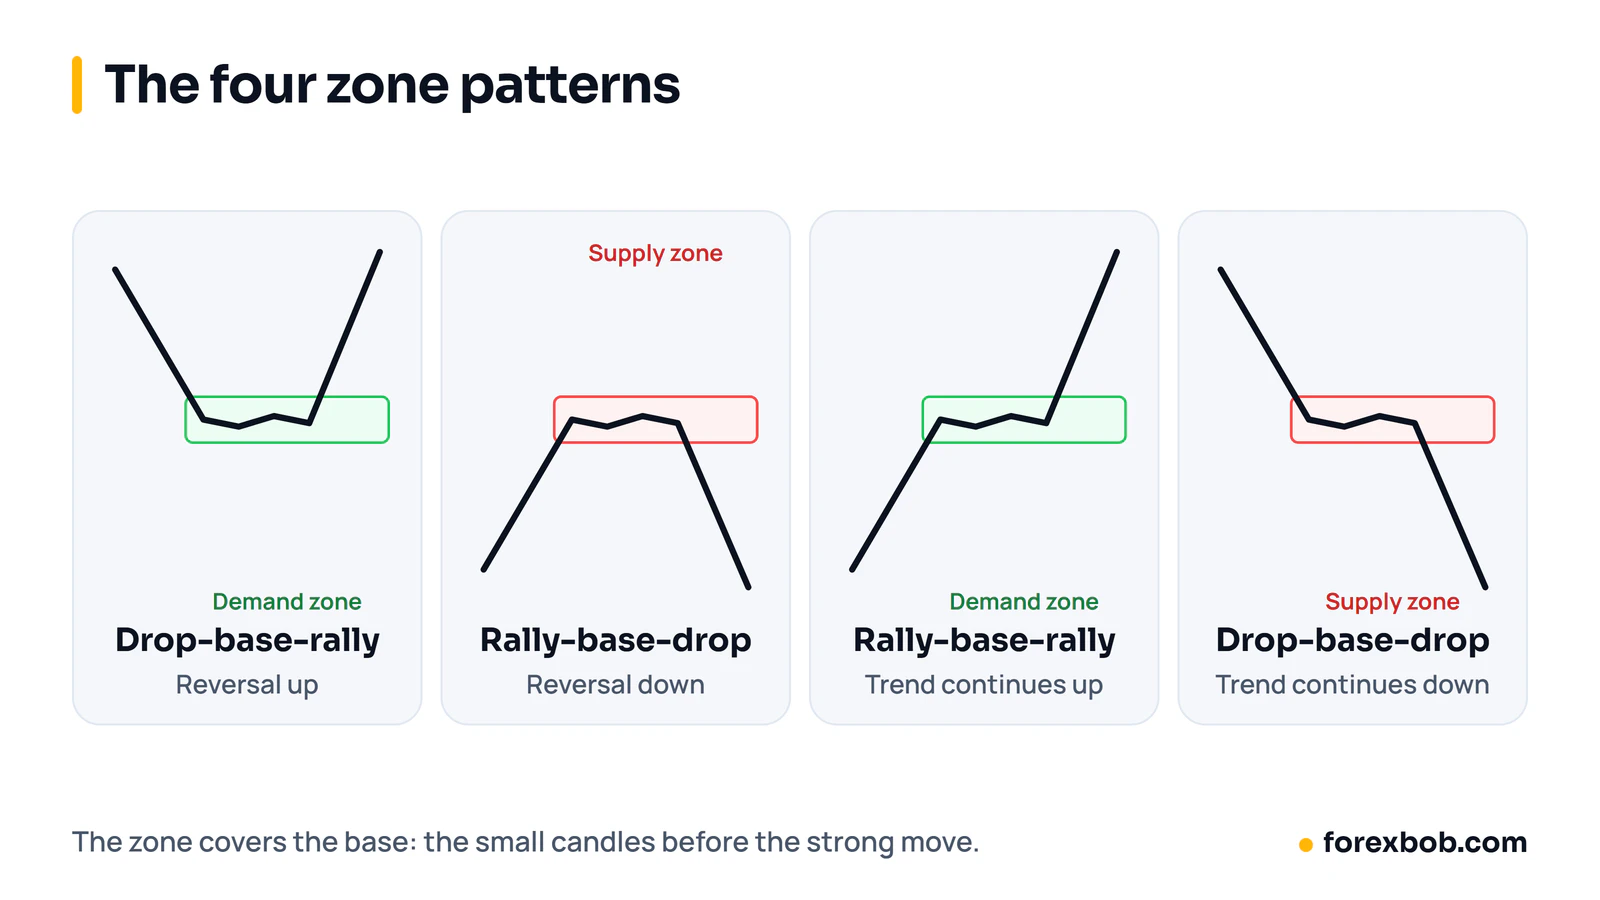
Most zones form around a base: a few small candles where price paused before the strong move. The zone covers that base.
The four zone patterns
- Drop-base-rally (DBR): price falls, pauses, then rallies hard. A demand zone, and a reversal.
- Rally-base-drop (RBD): price rises, pauses, then falls hard. A supply zone, and a reversal.
- Rally-base-rally (RBR): price rises, pauses, then keeps rising. A demand zone inside an uptrend.
- Drop-base-drop (DBD): price falls, pauses, then keeps falling. A supply zone inside a downtrend.
How to draw a zone
- Find a strong move: several large candles in a row, with little overlap between them.
- Go back to where it started and find the base, usually one to six small candles.
- Draw the zone from the edge of the base nearest current price (the proximal line) to the far edge (the distal line). Some traders use candle bodies for the near edge and wicks for the far edge.
Do this on the timeframe you trade, then check a higher one. A demand zone on the hourly chart that sits inside a daily demand zone has more behind it than one standing alone.
What makes a zone worth trading
- A strong departure. Big candles leaving the base suggest real imbalance. A slow drift away suggests very little.
- A short base. The less time spent at the base, the more orders are thought to be left behind.
- Freshness. The first return to a zone is usually considered the best. Each touch uses up some of the orders, so many traders skip a zone after one or two tests.
- Room to the next zone. If the opposite zone is close, the trade has little room to pay.
Entries, stops and targets
The simplest entry is a limit order at the proximal line. More cautious traders wait for a reaction inside the zone, such as a rejection candle on a lower timeframe, and accept that some trades will leave without them.
The stop goes beyond the distal line, with a buffer for the spread and normal noise. The first target is often the nearest opposing zone. That gives a fixed risk-reward you can check before entering.
Supply and demand vs support and resistance
They overlap a lot. Support and resistance are usually drawn as lines where price has turned several times, and more touches make the level look stronger. Supply and demand traders think the opposite: each touch uses up orders, so a zone tested many times is weaker. Zones are areas, not lines, and they come from one sharp move rather than repeated turns.
What testing showed
We had an EA that traded zones of this kind on gold, with the full zone life cycle coded in: detection, first and second touch, breakeven move and invalidation. The user wanted to know if it would work on EUR/USD with smaller zones, so we ran it on seven years of data, 2019 to 2026.
We tried five zone sizes, from 2 to 10 pips, with three ways of managing the trade. That is 15 combinations. All 15 lost money. The best one, an 8-pip zone with a simple 1:1 target, took about 4,000 trades, won 48.9% of them and lost 0.076R per trade on average. It lost money in every one of the eight years.
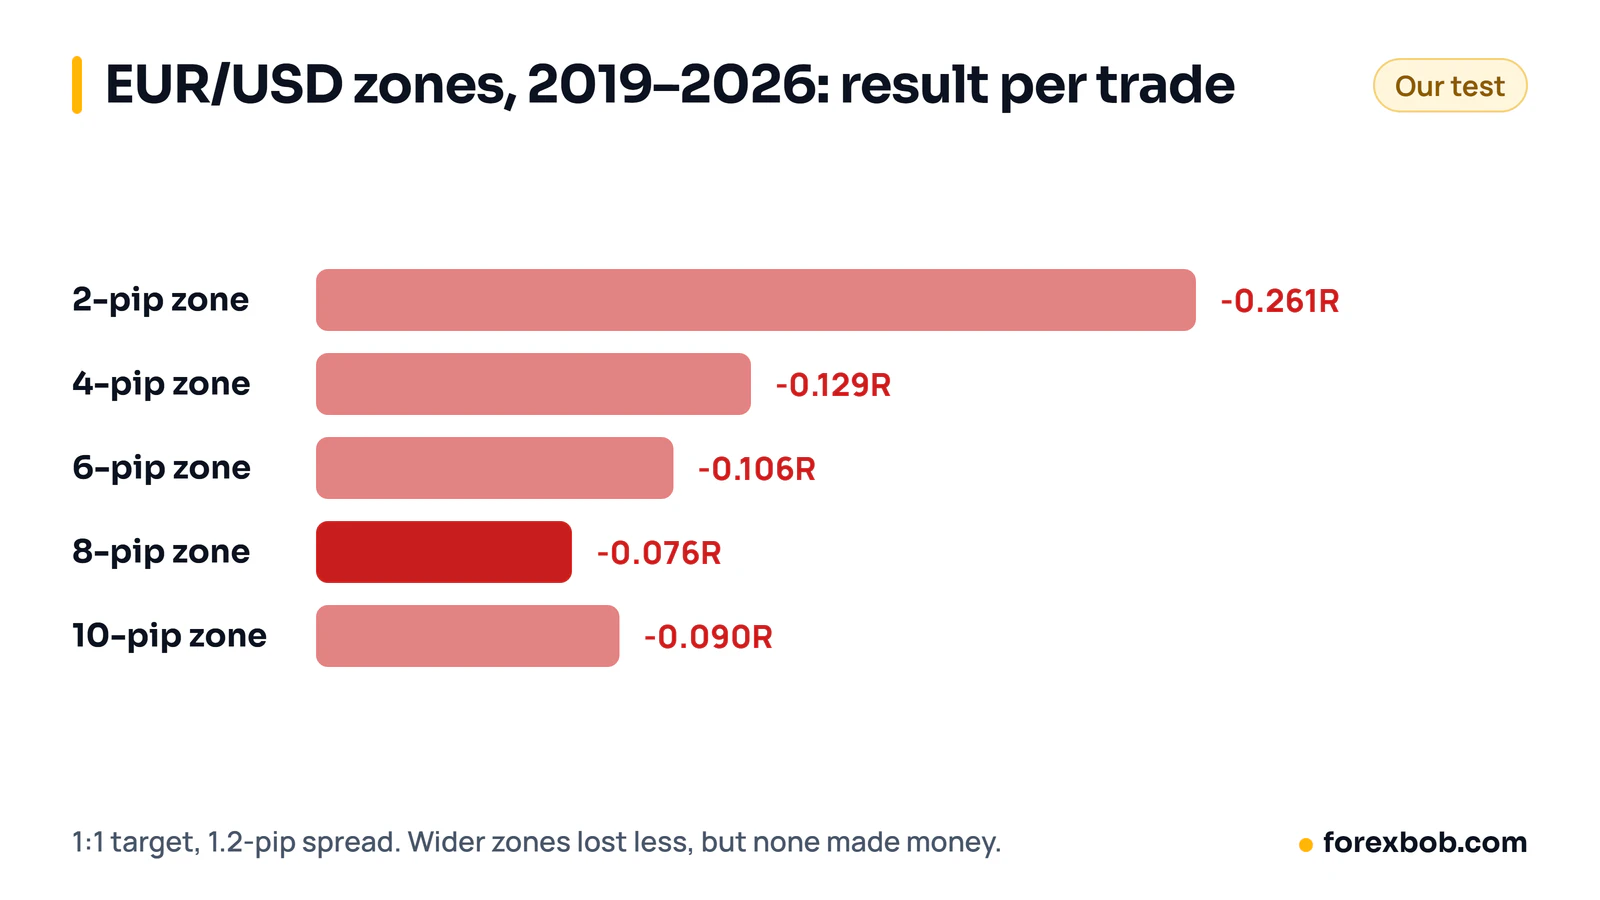
The pattern in those results is worth knowing. The loss per trade shrank as zones got wider, from −0.26R at 2 pips to −0.08R at 8 pips. With a 1.2-pip spread, a tiny zone means the spread is a big slice of every trade's risk. Wider zones dilute the cost, but in this test they never got the strategy above zero.
That does not prove supply and demand can't work. It shows that a zone rule which looks good on a chart needs a real test with real costs before money goes on it. Our guide to backtesting a trading idea explains how to set one up.
Common mistakes
- Drawing zones everywhere. If every pause is a zone, price will always be near one. Only mark the bases behind strong moves.
- Ignoring the spread on small zones. A 3-pip zone with a 1-pip spread starts each trade a third of the way to its stop.
- Trading old, worn zones. A zone price has already returned to three times is not fresh.
- Trading against the higher timeframe. A small demand zone in a strong daily downtrend is often just a pause.
Keep reading: order block trading, ICT trading strategy, how to backtest a trading idea and risk-reward ratio vs win rate.
Risk note: trading forex carries a high level of risk and may not be suitable for everyone. This article is for education only and is not financial advice.
Have a strategy you want automated?
We turn trading rules into tested Expert Advisors for MT4 and MT5. Tell us how you trade and we'll send a specification and a quote.
More articles

Forex risk management: the complete guide
Everything that decides how much you can lose, in one place: risk per trade, sizing, stops, leverage, correlated trades, drawdown limits and the extra risks of EAs.
Read article
Forex prop firms explained: funded accounts, the rules and using EAs
What prop trading is, how forex funded account challenges work, the drawdown rules that end most attempts, what firms allow with EAs, and the maths behind passing.
Read article
ICT trading strategy explained, and what testing shows
Liquidity sweeps, market structure shifts, fair value gaps, kill zones and the silver bullet in plain terms, and what happened when we measured some of them on gold.
Read article