
Walk-forward optimization: how to run it in MT5
How walk-forward optimization works, how to pick the window lengths, how to run it window by window in MT5, and what the results can and cannot tell you.
Walk-forward optimization tests whether an EA's optimized settings still work on prices they were not tuned on. You optimize on one stretch of history (the in-sample window), run the best settings once on the stretch that follows (the out-of-sample window), then move both windows forward and repeat. Put the out-of-sample stretches together and you have a record built only from data the settings had never seen.
MT5 does one of those steps for you with its Forward setting. There is no button for the full rolling version, so this guide shows how to run it by hand, how to choose the window lengths and how to read what comes out.
Why one optimization is not enough
An optimization runs an EA hundreds or thousands of times with different inputs and sorts the results. The top row looks great because it was picked for looking great on that exact data. With enough combinations, some settings will fit the noise in the prices rather than anything that repeats. Our guide on how to backtest a trading idea calls this curve fitting.
A single out-of-sample test helps, and the Forward setting in MT5 gives you one. But one test is one sample. The settings might pass because the next six months happened to suit them. Walk-forward repeats the test across many periods and market conditions. It also copies what you would do with a live EA: re-optimize now and then, and trade the new settings on prices that have not happened yet.
How walk-forward optimization works
Three numbers define a walk-forward test:
- In-sample length: the history you optimize on, for example 24 months.
- Out-of-sample length: the period you test the chosen settings on, for example 6 months.
- Step: how far both windows move each time. The step is usually the same as the out-of-sample length, so the test periods sit end to end without overlapping.
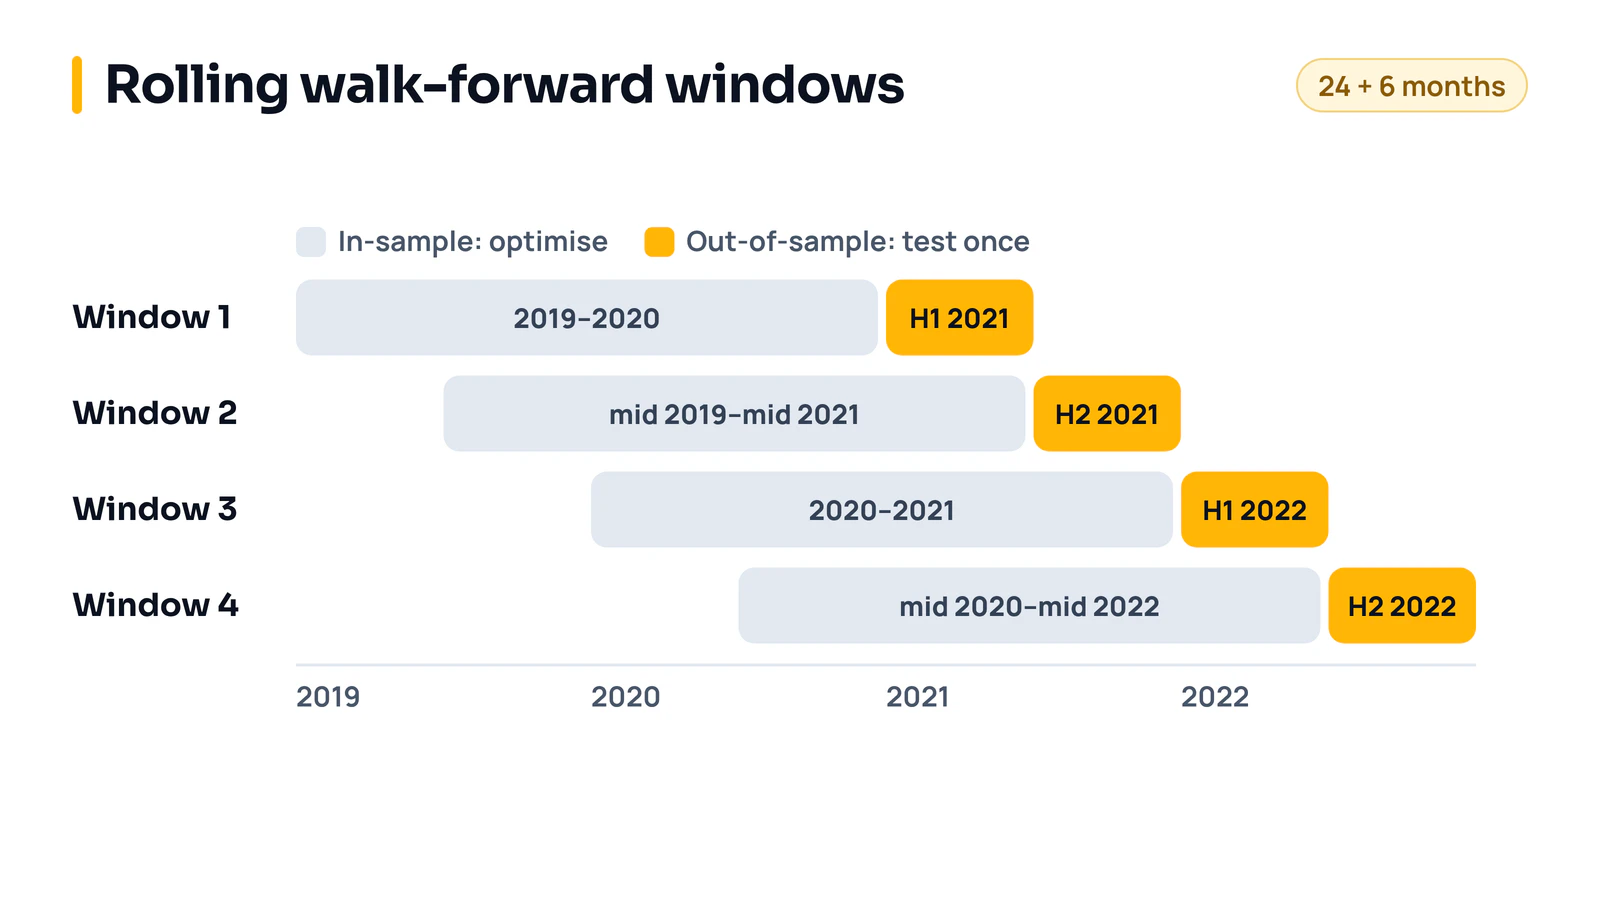
With 24 and 6 months, starting in January 2019, window 1 optimizes on 2019 and 2020 and tests on the first half of 2021. Window 2 optimizes on mid-2019 to mid-2021 and tests on the second half of 2021. Seven years of data, 2019 to 2025, gives ten windows and five years of out-of-sample results.
Rolling or anchored windows
In a rolling test, like the one above, the in-sample window keeps its length and drops the oldest months as it moves. In an anchored test the start date stays fixed and the in-sample window grows: 2019 to 2020, then 2019 to mid-2021, and so on.
Rolling reacts faster to recent conditions. Anchored gives each optimization more data, which steadies the settings but makes them slower to change. If you are unsure, start with rolling, because it is closer to how most traders re-optimize a live EA.
Choosing the window lengths
No length is correct for every EA, but you can go wrong in either direction:
- The in-sample window needs enough trades to rank the settings fairly, and it should cover more than one kind of market. A window that holds only a calm trend tells the optimizer nothing about a choppy year.
- The out-of-sample window needs enough trades to mean something. If a six-month window holds eight trades, its result is mostly luck. Lengthen the windows, or accept that a slow strategy needs many years of data for this test.
- Many traders make the out-of-sample window a quarter to a third of the in-sample length. That matches the 1/4 and 1/3 choices in the MT5 Forward setting, and it is a reasonable place to start.
- Use the out-of-sample length to answer a practical question: how often would you re-optimize the EA live? If you would re-tune it every quarter, test with three-month windows.
Fix the lengths before you look at any results. If you try several sets of window lengths and keep the best, you have run another optimization and the curve fitting is back.
Running one window in the MT5 Strategy Tester
Open the tester with Ctrl+R. If the settings are new to you, read our MT5 Strategy Tester guide first. For window 1 in the example:
- On the Settings tab, choose the EA, symbol and timeframe. Set the dates from the start of the in-sample window to the end of the out-of-sample window: 1 January 2019 to 30 June 2021.
- Set Forward to Custom and enter the date the out-of-sample window starts, 1 January 2021. MT5 now optimizes only on the dates before it.
- Pick the modelling mode you trust for this EA and add a realistic delay. Choose Slow complete algorithm for a small grid of inputs or Fast genetic based algorithm for a large one, and pick the criterion you care about, such as Balance max or Recovery Factor max.
- On the Inputs tab, tick the two or three inputs you want to optimize and give each a start, step and stop. Leave everything else fixed.
- Click Start. When it finishes, the Optimization results tab ranks the in-sample passes and the Forward results tab shows how they did on the forward dates.
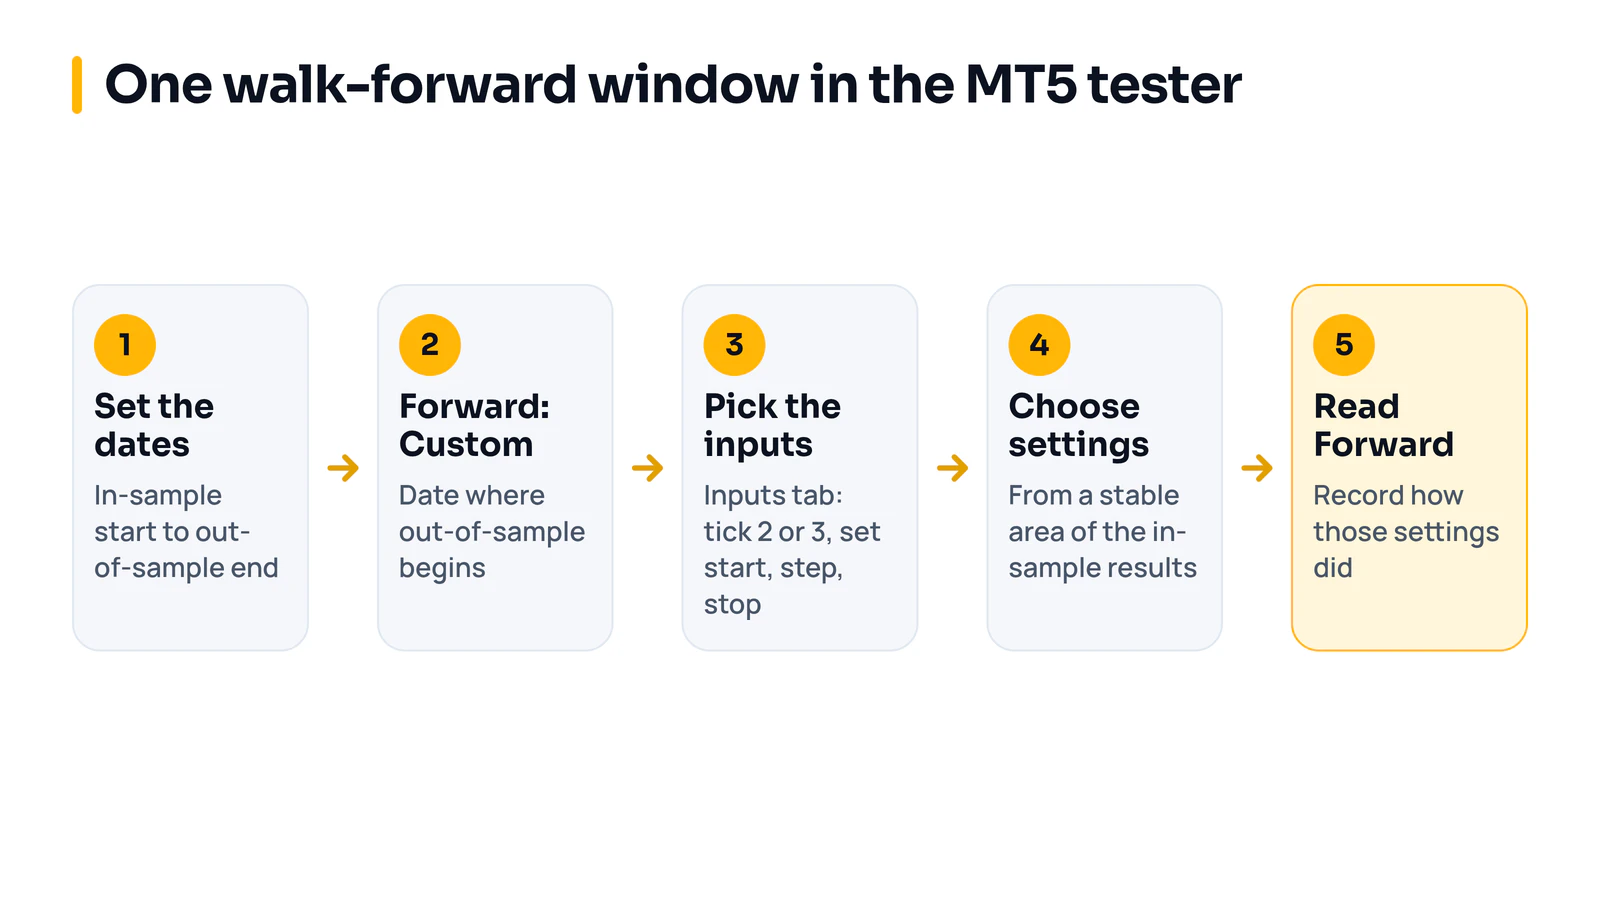
Choose the settings from the in-sample results only. If you scroll through the Forward tab and pick the pass that did best there, the out-of-sample period has become a second in-sample period. Prefer a setting in a broad area of good results over a lone peak, as the tester guide explains. Then run a single test with those inputs on the out-of-sample dates, so you get a full report for that window.
For window 2, move the start date, end date and Forward date on by six months and run it again. Keep the same inputs, ranges, criterion and modelling for every window. A spreadsheet with one row per window is enough: dates, chosen inputs, out-of-sample net profit, maximum drawdown and number of trades.
Reading the results
When every window is done, judge the out-of-sample rows together. Four checks tell you most of what you need.
Does it hold up in most windows?
One great window and nine flat ones is a weak result, even if the total looks fine. Look at how the profit is spread across windows, and count the windows that lost money.
Walk-forward efficiency
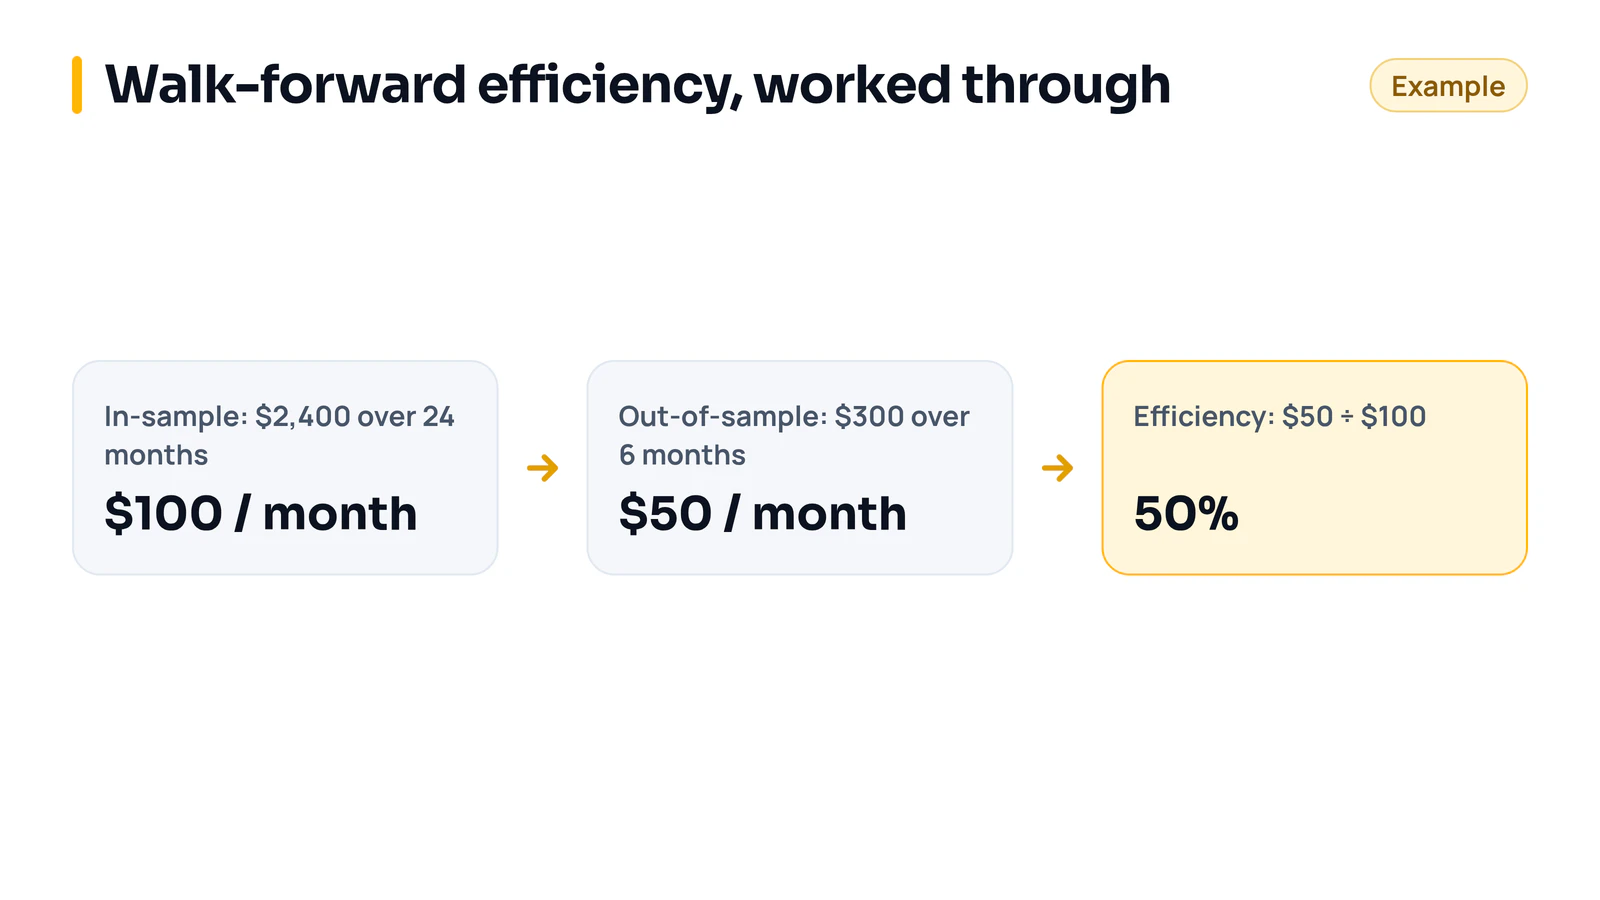
Walk-forward efficiency compares the out-of-sample pace with the in-sample pace. The idea comes from Robert Pardo's books on testing trading strategies. Because the two periods have different lengths, compare profit per month (or per year), not the raw totals. An EA that kept half its in-sample pace scores 50%. A score near zero, or below it, means the optimization mostly found noise.
Do the chosen inputs jump around?
If the best stop loss is 20 pips in one window, 80 in the next and 35 after that, the EA has no stable sweet spot, and each optimization is chasing the latest noise. Inputs that drift slowly from window to window are a much better sign.
How deep is the out-of-sample drawdown?
Compare the worst out-of-sample drawdown with the in-sample ones. If it is much deeper, size your risk around the out-of-sample figure. Our guide to drawdowns and losing streaks explains why the deepest drawdown is usually still ahead of you.
Finally, join the out-of-sample periods into one equity curve and judge the EA on that. It is the closest a backtest gets to a live record, and it still has to prove itself on a demo account.
What walk-forward cannot tell you
- It still runs on past prices. If the market changes in a way none of the windows saw, the EA meets it unprepared.
- It inherits the tester's errors. Bar modelling that flatters a trailing stop flatters every window. Use real ticks where the EA needs them, and costs at your broker's levels.
- If you run walk-forward on twenty ideas and keep the one that passed, you have optimized again at a higher level. The more strategies you push through it, the more likely one passes by chance.
- It tests the whole re-optimizing routine. A pass means the plan "re-optimize every six months on the last two years" held up. Follow that same plan live, or you are trading something you did not test.
Mistakes in walk-forward tests
- Picking the settings by looking at the Forward tab.
- Changing the input ranges or the criterion between windows.
- Out-of-sample windows with only a handful of trades each.
- Optimizing ten inputs at once, which gives the tester many more ways to fit noise.
- Dropping the windows that lost money as "unusual markets".
- Doing all the work, then showing only the in-sample equity curve.
When you assess someone else's EA, ask whether its settings came from a walk-forward or from one optimization over the whole period. Our checklist on how to judge an Expert Advisor covers the other questions to ask. If you have rules you want turned into an EA you can test this way, see our EA development service.
Keep reading: the MT5 Strategy Tester guide, how to backtest a trading idea and how to judge an Expert Advisor.
Risk note: trading forex carries a high level of risk and may not be suitable for everyone. This article is for education only and is not financial advice.
Have a strategy you want automated?
We turn trading rules into tested Expert Advisors for MT4 and MT5. Tell us how you trade and we'll send a specification and a quote.
More articles

How to install an Expert Advisor in MT5 and MT4
Where the EA file goes, how to attach it to a chart, which switches must be on, and what to check when an installed EA still does not trade.
Read article
Supply and demand trading: how to mark zones, and what testing shows
How to find supply and demand zones, draw them, enter and place stops. Then what happened when we tested a zone strategy on seven years of EUR/USD.
Read article
Forex risk management: the complete guide
Everything that decides how much you can lose, in one place: risk per trade, sizing, stops, leverage, correlated trades, drawdown limits and the extra risks of EAs.
Read article