
ATR stop loss: how to set it and which multiplier to use
How an ATR stop loss works, how to read the ATR in MT5 and turn it into pips, which multiplier to start with, how to size the trade, and how to trail it.

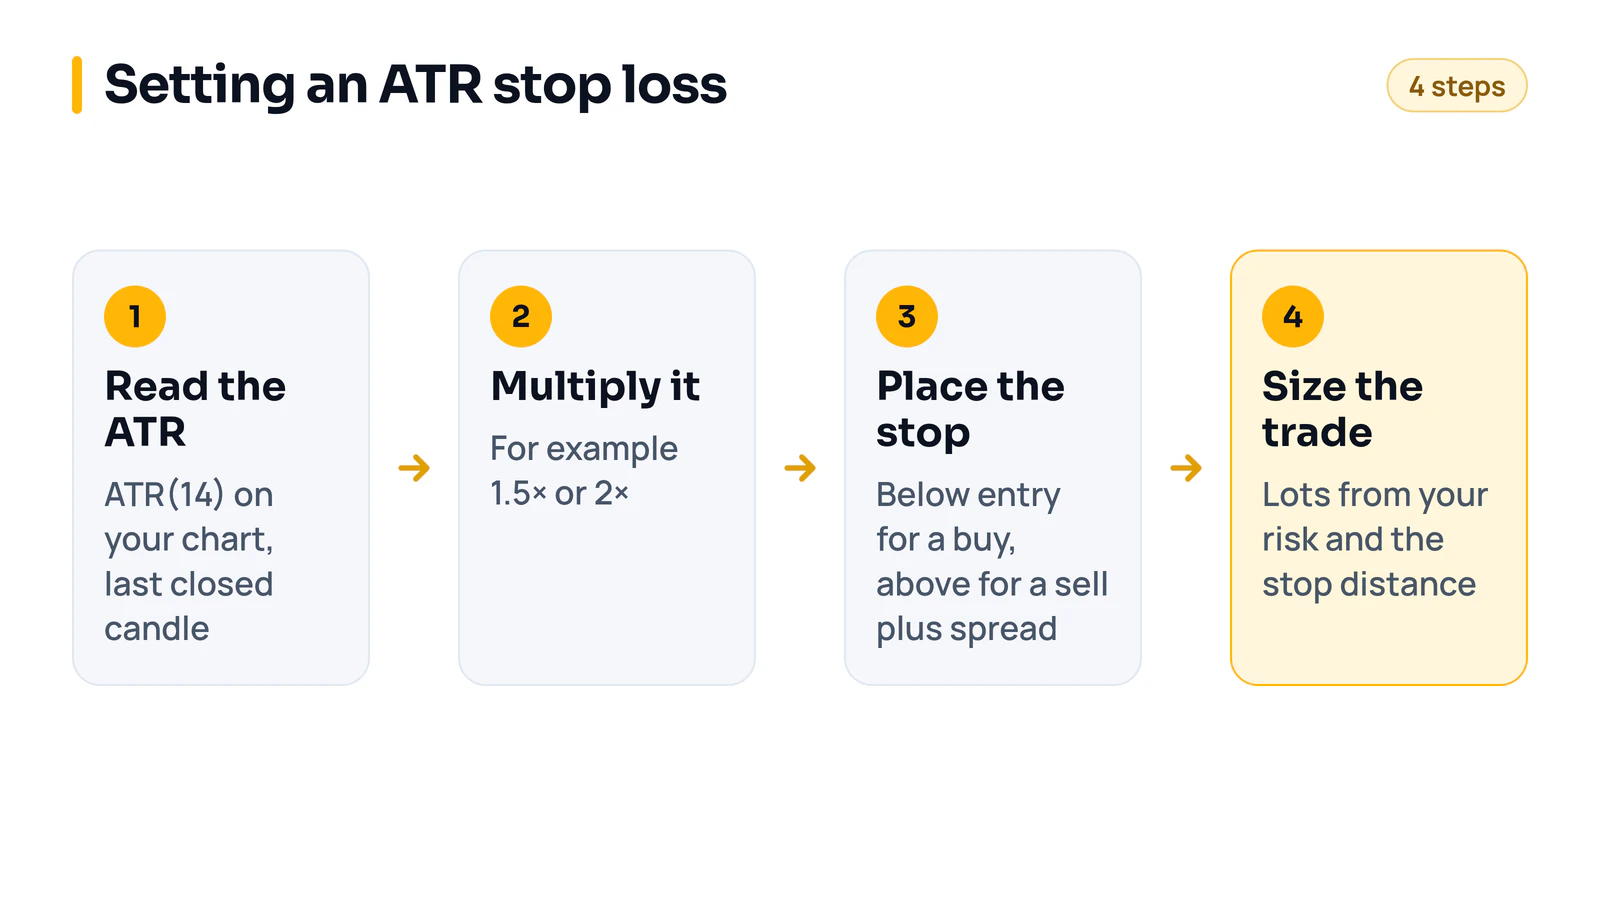
An ATR stop loss puts your stop a set multiple of the Average True Range away from your entry. For a buy, the stop goes at entry minus the multiplier times the ATR; for a sell, at entry plus the multiplier times the ATR. Most traders start with the 14-period ATR of the timeframe they trade and a multiplier between 1.5 and 2, then size the position so that hitting the stop costs the amount they planned to risk.
The appeal is that the stop follows the market. On a quiet day the ATR is small and so is the stop. When volatility picks up, the stop moves further away and the position gets smaller, so the money at risk stays the same.
What the ATR measures
J. Welles Wilder introduced the Average True Range in 1978. It starts from the true range of each candle, which is the largest of three distances:
- the candle's high minus its low
- the high minus the previous close
- the previous close minus the low
The two extra distances catch gaps. If price closes at 1.0850 and the next candle opens at 1.0880 and trades between 1.0870 and 1.0890, the high-low range is 20 pips but the true range is 40, because the move from the previous close counts.
The ATR is the average of the last 14 true ranges (or whatever period you set). It tells you how far price usually travels in one candle and nothing about which way. MetaTrader's built-in ATR takes a simple average of the true ranges, while Wilder's original and TradingView's default use a smoothed average, so the same chart can show slightly different ATR values on the two platforms.
The ATR stop loss formula
- Buy: stop = entry − (multiplier × ATR)
- Sell: stop = entry + (multiplier × ATR), plus the spread
The spread matters on sells because a short position closes at the ask, and your chart shows the bid. Our guide on where to place a stop loss explains why a sell stop can be hit when the chart never touches it.
A worked example: EUR/USD on the one-hour chart, ATR(14) at 0.0012, which is 12 pips. With a multiplier of 2 the stop distance is 24 pips. Buy at 1.0850 and the stop goes at 1.0826. Sell at 1.0850 and it goes at 1.0874, plus the spread.
Reading the ATR in MT5
- Open the chart and timeframe you trade.
- Go to Insert, Indicators, Oscillators, Average True Range. Leave the period at 14 and click OK. The ATR opens in its own window under the chart.
- Open the Data Window with Ctrl+D and hover over the last closed candle. The ATR line shows the value for that candle.
Use the last closed candle. The value on the candle still forming changes with every tick, and it is usually low early in the candle because the range has not built up yet.
The ATR is shown in price, not pips, so you have to convert it:
- EUR/USD and most pairs: 0.0012 is 12 pips (one pip is 0.0001).
- USD/JPY and other yen pairs: 0.18 is 18 pips (one pip is 0.01).
- Gold (XAU/USD): 4.50 is a $4.50 move. Our calculators count a gold pip as $0.10, so that is 45 pips. Brokers define gold pips differently, so go by price.
Choosing the multiplier
There is no best multiplier. The right one depends on how long you hold a trade, how much noise your entry has to survive and where the chart says your idea is wrong. These are common starting points:
- 1 × ATR puts the stop inside one candle's normal range. Ordinary chop takes it out often, so few strategies can live with it.
- 1.5 × ATR is a common start for intraday trades where the entry is timed closely.
- 2 × ATR is a common start for swing and breakout trades that need room to develop.
- 3 × ATR is wide for a first stop. It is the usual setting for ATR trailing stops.
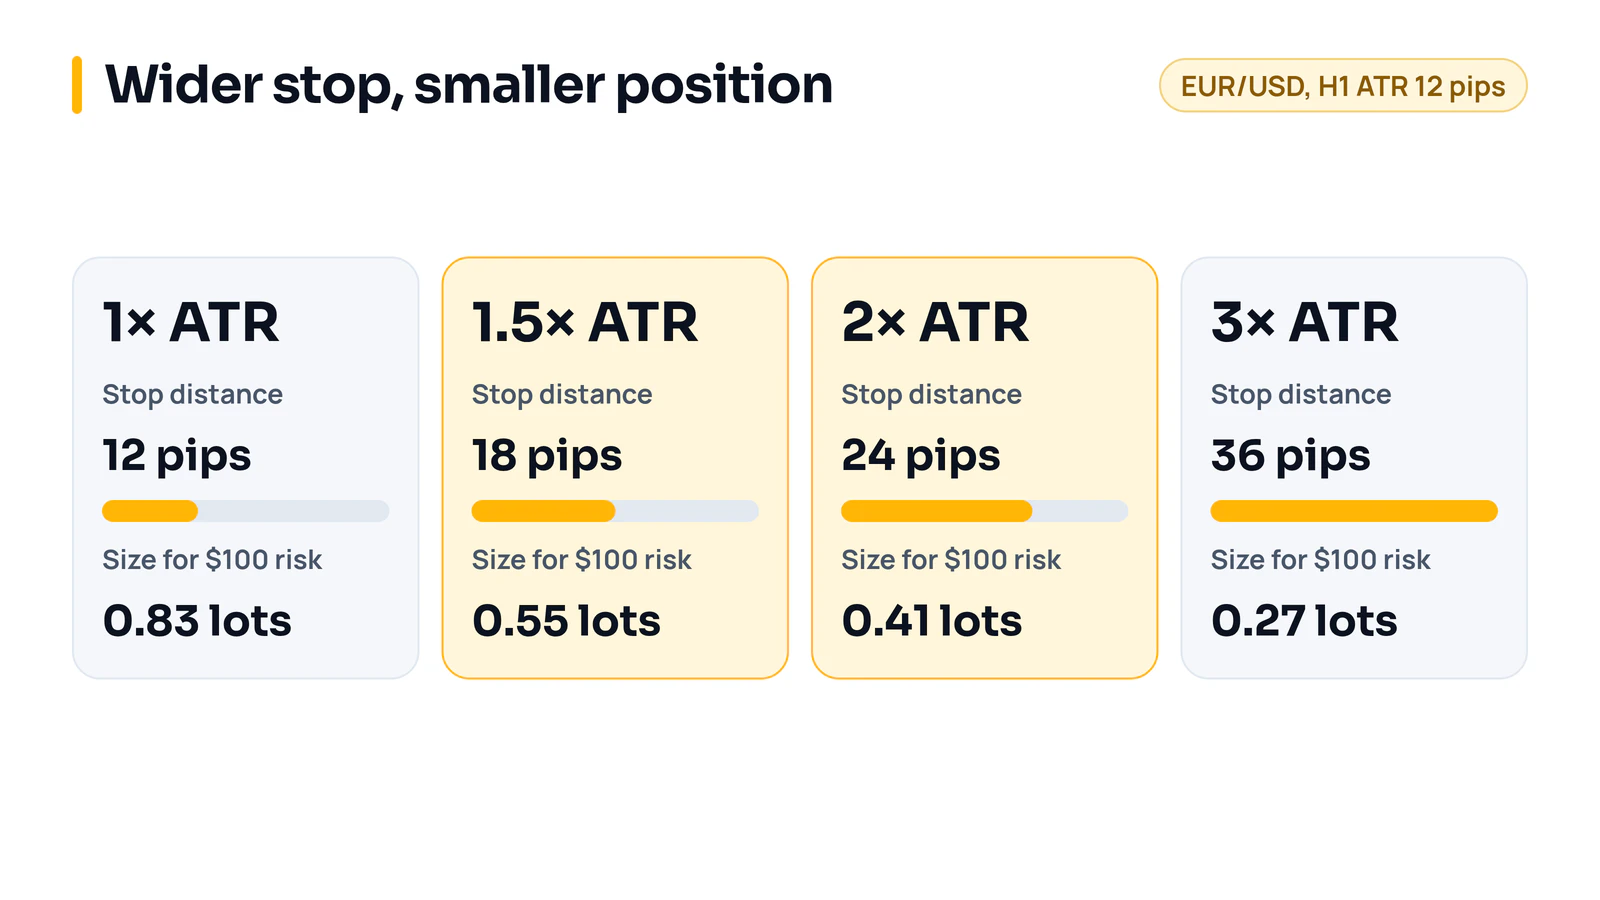
A wider stop is not a bigger risk if you size the trade from it. On the EUR/USD example with $100 at risk, a 12-pip stop allows 0.83 lots, while a 36-pip stop allows 0.27 lots. Each loss costs the same $100. What changes is how often the stop is hit and how far price has to run to reach a given target.
Check the ATR stop against the chart too. If a 1.5 × ATR stop for a buy sits a few pips above an obvious swing low, move it just below the low and accept a slightly smaller position. If the swing low is only a third of an ATR away, a stop there is probably too tight for normal noise.
The way to settle the multiplier for a mechanical strategy is to test it. Run the strategy in the MT5 Strategy Tester with the multiplier as an input, for example from 1 to 3 in steps of 0.25. Look for a broad range of values that all do reasonably well rather than the single best one. If 1.75 is great and 1.5 and 2 are poor, the result is luck.
Which timeframe and period
Use the ATR of the timeframe your trade lives on. A trade planned on the one-hour chart needs the one-hour ATR. A daily ATR would give it a stop several times too wide, and a five-minute ATR one far too tight.
The 14-period default is fine for most uses. A shorter period, such as 5 or 7, reacts faster to a change in volatility and jumps around more. A longer one, such as 20 or 50, is steadier and slower to notice a market waking up.
Watch the time of day on intraday charts. An hourly ATR read in the quiet Asian hours reflects quiet candles, and a stop built from it can be too tight once London opens. The opposite happens after a big news candle: one huge range lifts the ATR for the next 14 candles, so stops come out wider than the market now needs. Our guide to forex trading sessions shows when each market is active.
Sizing the position from the ATR stop
Once the stop distance is known, the position size follows from your risk: lots = money at risk ÷ (stop in pips × pip value per lot). Our article on how much to risk per trade explains the formula, and the calculator at the end of this page does the sum.
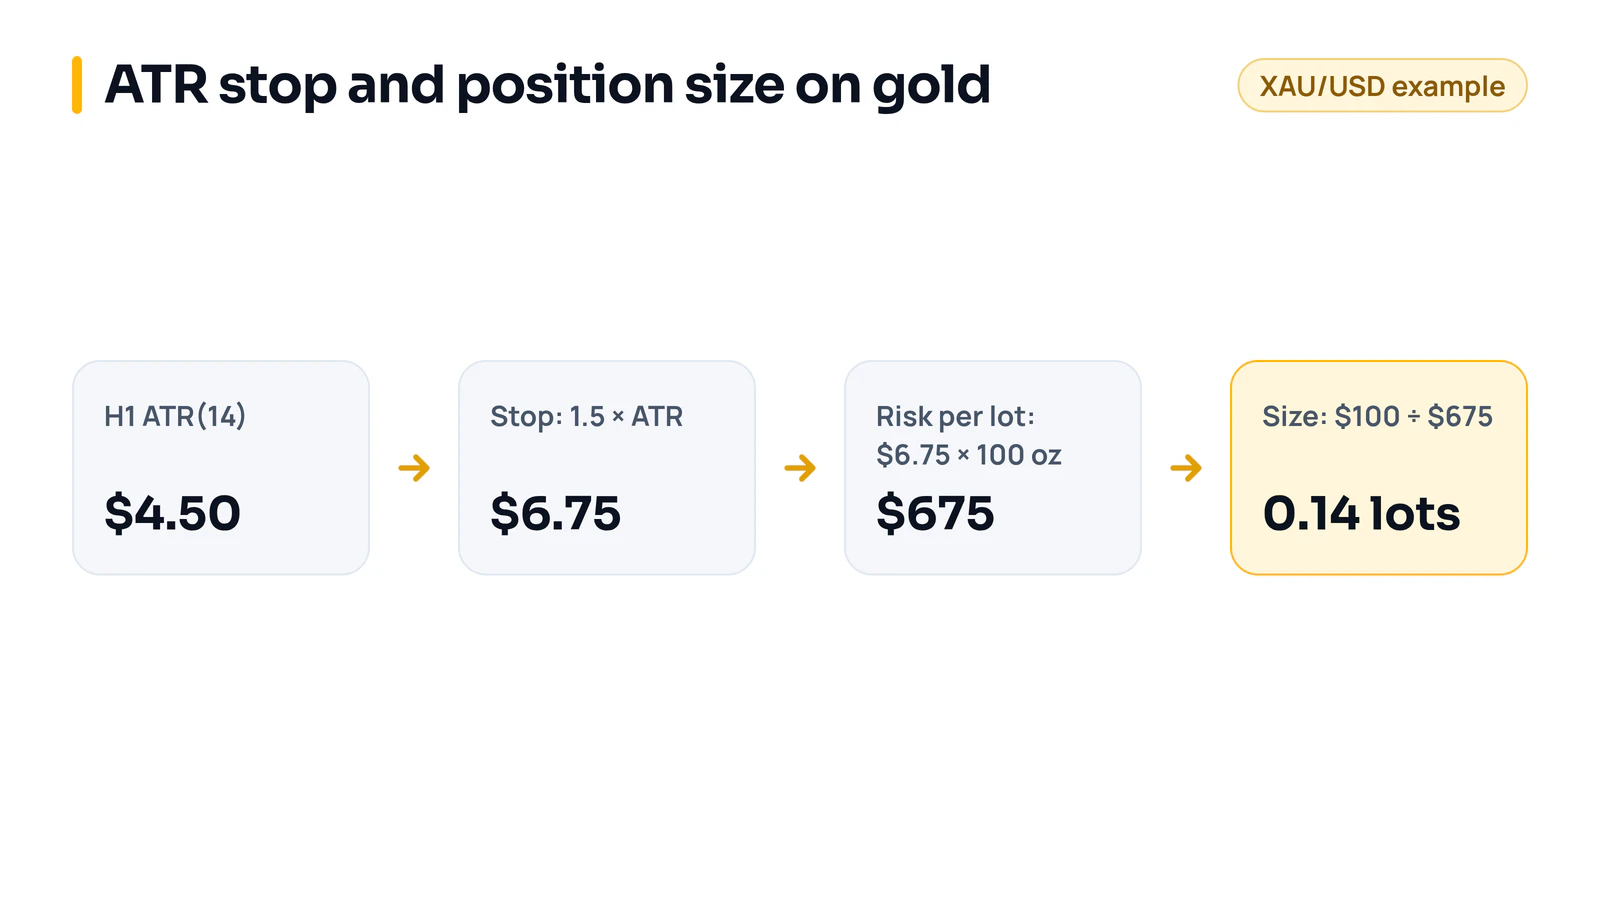
A gold example with a $10,000 account risking 1%, which is $100. The hourly ATR(14) is $4.50 and you use 1.5 × ATR, so the stop is $6.75 from entry. One lot is 100 ounces, so a $6.75 move costs $675 per lot. $100 ÷ $675 is 0.148 lots, which you round down to 0.14.
Always round down. Rounding up puts a little more than your planned risk on every trade.
Trailing a stop with ATR
An ATR trailing stop follows price at a distance of a few ATRs. The best-known version is Chuck LeBeau's chandelier exit: for a long trade, the stop sits at the highest high since entry minus 3 × ATR, usually with a 22-period ATR. For a short, it sits at the lowest low since entry plus 3 × ATR.
Two rules for the trail:
- The stop only moves in the trade's favour. If the ATR rises and the formula gives a lower stop on a long trade, keep the old one.
- Recalculate on closed candles, not on every tick, so one spike doesn't drag the stop around.
The trailing stop built into MT4 and MT5 moves by a fixed number of points and runs in your terminal, so it stops working when MetaTrader closes. It cannot follow the ATR. For an ATR trail you need an Expert Advisor or a trade manager that modifies the stop for you. Our page on trailing stop vs stop loss covers how the different stop orders behave in a gap.
ATR stops in an Expert Advisor
In MQL5 an ATR stop takes five steps:
- Create the indicator once in OnInit with iATR(symbol, timeframe, 14).
- When a trade is due, copy the value of the last closed candle with CopyBuffer, using shift 1.
- Multiply by the input multiplier, subtract it from the entry for a buy or add it for a sell, and round the price to the symbol's digits.
- Check the result against the broker's minimum stop distance (SYMBOL_TRADE_STOPS_LEVEL) before sending the order, or the order is rejected.
- Work out the lot size from the stop distance and the risk input, then round it down to the broker's volume step.
Make the period, timeframe and multiplier inputs so they can be tested. If you trail with ATR, test on real ticks: bar modelling moves a trailing stop only once per bar and can make the results look better than they are, as our Strategy Tester guide shows.
When we code an ATR stop into a client's EA, the ATR period, timeframe and multiplier are inputs rather than fixed numbers. That way the client can test them in the Strategy Tester and change them later without new code.
Mistakes with ATR stops
- Taking the ATR from a different timeframe than the one you trade.
- Reading the ATR from the candle that is still forming.
- Setting an ATR stop and then trading your usual lot size. The stop adapts, but the risk doesn't unless the size changes with it.
- Recalculating the stop while the trade is open and moving it further away because the ATR went up.
- Treating a high ATR as a signal. It measures movement, not direction.
- Forgetting the spread on sells, which matters most when the ATR is small.
FAQ
What is a good ATR multiplier for a stop loss?
1.5 to 2 times the 14-period ATR is the usual starting range for an initial stop, and around 3 times for a trailing stop. The right value for your strategy is the one that holds up across a range of nearby settings in a backtest, not one copied from someone else.
Is 2 ATR a good stop loss?
It is a reasonable default for swing and breakout trades, because most normal candle-to-candle noise stays inside it. It can be too wide for a tightly timed intraday entry. Whatever multiplier you use, size the position from it so the money at risk stays fixed.
Should I use an ATR stop or a stop at a swing high or low?
Use both. The swing level tells you where the trade idea is wrong, and the ATR tells you whether that level is far enough away to survive normal movement. If they disagree a lot, the trade may not be worth taking.
Does an ATR stop work on gold and crypto?
Yes. The ATR measures movement in price, so it works on any market. It is especially useful on gold and crypto, where volatility changes a lot from one session or week to the next. Convert the ATR to money per lot with your broker's contract size before you size the trade.
Keep reading: where to place a stop loss, how much to risk per trade, trailing stop vs stop loss and the position size calculator.
Risk note: trading forex carries a high level of risk and may not be suitable for everyone. This article is for education only and is not financial advice.
Position size
0.40 lots
40,000 units
Amount at risk
$100.00
Pip value (1 lot)
$10.00
Mini lots
4.0
Micro lots
40
Have a strategy you want automated?
We turn trading rules into tested Expert Advisors for MT4 and MT5. Tell us how you trade and we'll send a specification and a quote.
More articles
Walk-forward optimization: how to run it in MT5
How walk-forward optimization works, how to pick the window lengths, how to run it window by window in MT5, and what the results can and cannot tell you.
Read article
How to install an Expert Advisor in MT5 and MT4
Where the EA file goes, how to attach it to a chart, which switches must be on, and what to check when an installed EA still does not trade.
Read article
Supply and demand trading: how to mark zones, and what testing shows
How to find supply and demand zones, draw them, enter and place stops. Then what happened when we tested a zone strategy on seven years of EUR/USD.
Read article